


The 2016 PSMJ AE Financial Performance Benchmark Survey reflects a design industry that is experiencing steady growth of gross revenue and profits, and overhead rates that are holding relatively steady. Consider the following list of key overall trends from last year to this year (the actual metrics are revealed in the survey report):
-
The net multiplier achieved held steady, compared to the target net multiplier which indicates that the financial performance of projects is closely matching firms’ expectations.
-
Operating profits (before incentive/bonuses and taxes) as a percentage of net
revenues increased this year.
-
Gross revenues increased this year, after an increase in 2014 and 2013, and no growth in 2011.
-
Backlogs grew last year, indicating a 10% increase for the median firm, as
compared to a 9% increase in 2015.
-
This year’s results indicate growth in staff size, as compared to in 2015, reflecting the overall confidence in the economy.
-
Overhead rates decreased slightly, as compared to 2015. We expect continued emphasis on reducing or stabilizing overhead costs.
A good snapshot of how the AE industry has performed is presented in the figure below. This chart indicates the variation in direct labor, overhead costs, and profit as a function of direct labor hours over the past 12 years.
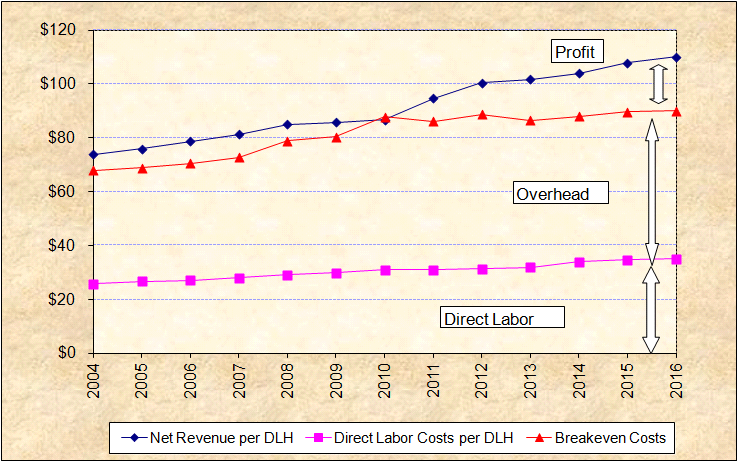
Reasonable profits were being achieved until 2002, when the impact of an economic downturn hit the industry. As the design industry recovered between 2004 and 2007, firms were able to raise prices, hold the level of overhead costs steady, and generate higher profits.
Unfortunately, as the economic climate shifted to severe contraction and recession, 2010’s survey results indicated that profits were being squeezed again as overhead costs increased faster than net revenues over the previous three years.
This year’s results indicate significantly higher profits, exceeding the all-time highs set in 2007. Whether these higher profit levels can be sustained and remain for a comparable period of time will be the subject of future surveys.
 How does your architecture or engineering firm’s financial performance stack up against the competition? Where do you excel and where do you fall short compared to architecture or engineering firms of similar size, type or market sector served? Did your strategic initiatives deliver the results you expect? How fast is cash being collected in the industry today? How chargeable should your staff be and are you carrying too much labor overhead?
PSMJ’s 2016 Financial Performance Benchmark Survey Report puts the answers to these questions (and many more!) at your fingertips. This report contains the detailed information that your firm needs to thrive in today’s economy. In fact, we use a variety of key performance metrics from this report to select PSMJ’s prestigious Circle of Excellence, an elite group of the industry’s most successful firms!

You also might be interested in these benchmarking-related blog posts
Trend Line: How Do AE Firm Leaders Charge Their Time?
Data Dive: How Financial Performance Impacts Your Compensation Options
The War for Talent: Does Your Compensation Strategy Measure Up?
Trend Line: Larger Firm Equals Larger Compensation