The past two years I’ve written articles using financial benchmarking data as a window into the overall financial condition of the A/E industry and its impact on compensation.
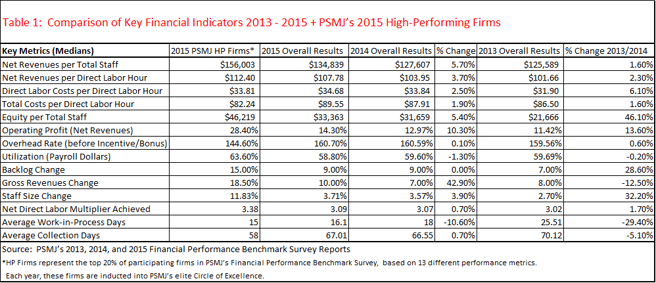
This year, I’d like to add to the discussion by highlighting architecture and engineering firms that are considered to be high performing (HP), based on their financial performance. HP firms reported nearly twice the profit, 28.4% on net revenues, compared to the overall industry, which reported a median profit of 14.3% in 2015.
Firms of all sizes and in all practice areas were in this high-performing group. When asked what the highperforming firms do differently, the answer was always the same: nothing special, but they “block and tackle” well. This means they have strong basic business skills.
These firms consistently monitor and measure their firm’s performance, keeping their eye on key results, which has resulted in a level of profitability that gives
them opportunities related to compensation that aren’t afforded to the “average” firm.
Overall Financial Performance Impacts Compensation Options
Financial metrics, calculated from information found in the income statement, tell the story of how operational decisions impact the overall performance of a firm. With profit, all things are possible. A more profitable firm simply has more options. For instance, options include offering a higher cash compensation strategy, which can help attract and retain talent; investing in the firm whether it be toward growth or internal ownership/leadership transition; developing a performance bonus system because the funds are available to make the payouts; and/or offering atypical benefits above and beyond the average firm.
Profit is one of the factors that gives firm owners the most latitude in creating the firm that supports their vision. But, because profitability is often influenced by the condition of the economy, it can seem elusive to firms struggling or maintaining middle-of-the road results. Therefore, it’s important to get the big picture by
looking back to where the economy stood a few years ago and how that relates to where we are today.
Where We Stood in 2013: Financial, Compensation Trends
To get started, let’s go back to our original findings. In the February 2014 issue of ASHRAE Journal, “Understanding Salaries in the A/E Industry” presented a discussion on cash compensation as it related to the overall financial health of the A/E industry, following the economic downturn of 2009. The intent was to help both engineer and employer better understand the current financial position of the industry and how that was impacting compensation options, using A/E industry specific benchmarking data. The 2013 benchmarking data revealed net revenues were rising slightly faster than expenses, and while overall profitability as a percentage of net revenues had improved (to a median of 11.4%), it still remained significantly below the 2007 high of 15.2% (median). The industry was improving but had not fully recovered from the recession in terms of profit and compensation rates. Overall, it appeared the A/E industry was poised for growth as the economy continued to improve.
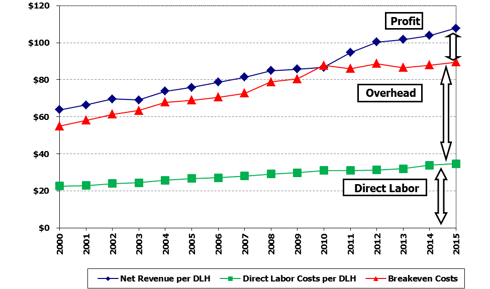
Figure 1: Historical Direct Labor Benchmark Trends – Overall Industry (Includes HP Firms)
Where We Stood in 2014: Financial, Compensation Trends
The 2014 results in the February 2015 follow-up article, “Engineers’ Pay and Financial Performance,” were encouraging: net revenues and profits rose faster than
expenses and labor costs. Overhead, as a percentage of direct labor costs, held steady near 160%; and profits (earnings before bonuses, discretionary distributions, and taxes = EBBT) increased by 10%, to a new median of 13.0% (still short of the 2007 high of 15.2%). Balance sheets were stronger, as evidenced by the substantial amount of equity firms were carrying per total staff, which increased from approximately $22,000 per staff to $32,000 per staff.
While total direct compensation for the majority of the senior-level roles (chairman of the board, CEO, COO, etc.) had yet to recover to 2009 numbers, more production-
focused positions/roles had generally increased and exceeded 2009 amounts (department head, senior project manager, and project manager). Overall, we
saw improvement in both financial performance and compensation.
Where We Stand for 2015: An Update On the Big Picture
With another year behind us and new data available, let’s look at the latest numbers to see where we stand and how much improvement the industry actually experienced in the past year. The tables and figures that follow report the median for each metric, which is the midpoint of a set of data (not the average). Many successful firms outperform the industry medians, and this year their median results have been provided as well (see 2015 PSMJ HP Firms in Table 1).
The 2015 overall results for the industry are encouraging! Net revenues per staff are up, profit is up, overhead costs held steady, and staff growth was positive. However,
the HP firms are achieving substantially higher net revenues per total staff and per direct labor hour (DLH), their overhead rate is 16 percentage points lower than
the industry median, and as a result their profitability is nearly twice that of the overall industry—plus they grew their firms in terms of revenue and staff, providing new opportunities in the process for staff and new hires.

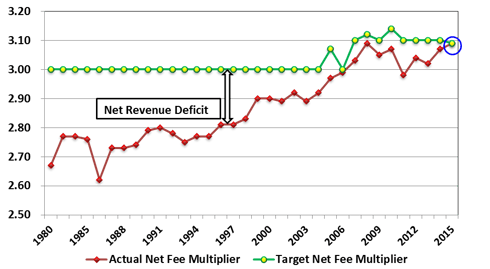
For both groups, revenues and profits are continuing to rise faster than expenses and labor costs, while still experiencing growth, which is great news. A detailed historical comparison of several of these key financial indicators is provided in Figure 1 and Table 2. More great news is the gap has nearly closed between
the target and the achieved direct labor multiplier (Figure 2). If the achieved is less than the target direct labor multiplier, the result is a net revenue deficit—less profit than expected. If the achieved is greater than the target direct labor multiplier, the result is a net revenue surplus—higher profits than expected. The improved results in Figure 2 generally indicate firms are achieving better fees for projects and/or those projects are being more efficiently managed, reducing the net revenue deficit.
Figure 2: Target Versus Achieved Direct Labor Multiplier
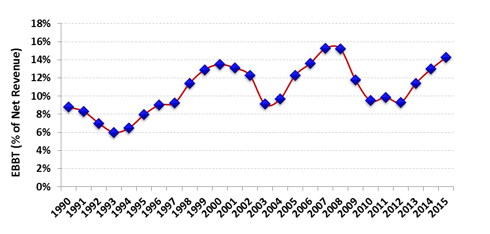
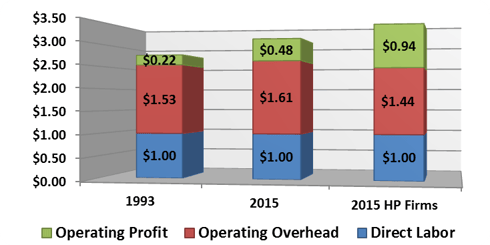
Unfortunately, the A/E industry is still struggling to earn a reasonable profit, but it’s headed in the right direction (Figures 3 and 4) and has seen a gain of 5 percentage points since the low point in 2010. Figure 4 takes a look at overhead costs and profitability for the overall industry, comparing the results of the 1993 downturn, the 2015 results, and PSMJ’s 2015 HP Firms.
Figure 3: Operating Profits as a Percentage of Net Revenues
Increased pricing, as evidenced by increased achieved net fee multipliers, drives higher net revenues per staff, which can be the result of the market accepting
increased billing rates, capturing change orders, or higher project efficiencies—and, if overhead can remain steady or decline, then profitability will continue to improve.
Every firm has the opportunity to be a high-performing firm with consistent monitoring and measuring of key performance indicators that allow management
teams to be proactive versus reactive. There is no “secret sauce,” as we’ve learned from these firms time after time; they have solid business processes that allow
them to manage their firms in a way that results in high profitability, which provides the key ingredient for compensation—cash.
Figure 4: Actual Margin Comparison
Compensation Trends
Annually, for the past 33 years, PSMJ Resources, Inc., has conducted a management compensation survey that solicits data from both engineering and architectural firms for 17 management positions, from chairman of the board to project manager. Historical total compensation is presented in Table 3 for the past seven years. Compensation rates generally increase with firm size, so use the information in Table 3 with caution. The table is presented to demonstrate trends only; for more detailed information, a full compensation study that analyzes data by firm size and other peer groups would be needed. The compensation rates for the HP Firms are not reported separately; however, notice that their direct labor costs per direct labor hour, as well as their total costs per direct labor hour are less than the 2015 overall median—compensation is not the key to their success (Table 1).
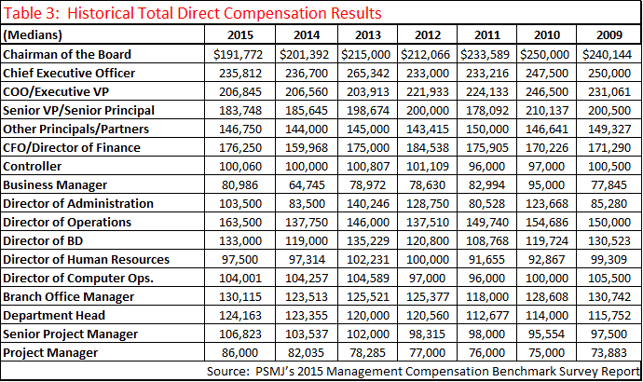
Total compensation reached a five-year high in 2009/2010 just before the recent recession and profit was at an all-time high as well, at 15.2% of net revenue.Total compensation fell to a five-year low in 2011/2012 for most positions/roles and profit was less than 10% from 2010 through 2012. The results are holding steady between 2014 and 2015. Total direct compensation for the majority of the senior-level roles (chairman of the board, CEO, COO, etc.) still has yet to recover to 2009 numbers. More production-focused positions/roles continue to increase and exceeded prerecession total compensation amounts as early as 2012 (department head, senior project manager, and project manager).
Billing Rate Trends
Compensation is directly related to hourly billing rates, which are intended to recover all design firm costs (including direct labor and overhead) and provide for profit. For example, if a highly billable senior project manager is paid $50 per hour (excludes labor burden or fringes), and the firm’s overhead rate is 160% on direct labor, then the break-even billing rate would be $50 × (1 + 1.6) = $130 per hour. A billing rate of $150 provides for about 13% profit (3.0 – 2.6)/3.0 = 0.13). Reimbursable expenses are recovered from the client directly and not included in these billing rates. If compensation rates exceed what can be recovered in billing rates, then profits may be negatively impacted.
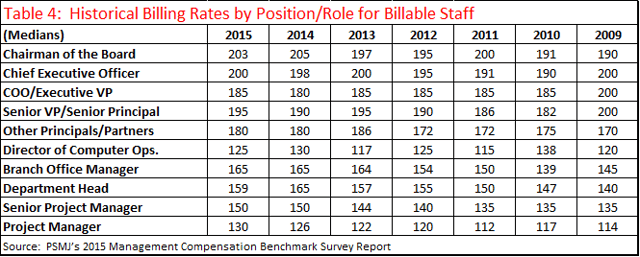
In the 2015 results, billing rates continue to track with total compensation. Many of the senior-level roles (COO and senior VP) still have yet to fully recover to prerecession rates, while more production-oriented positions (senior project manager,
project manager) exceeded prerecession rates as early as 2012, see Table 4.
Conclusion
The numbers tell the story: The achieved direct labor multiplieris on the rise and closer to target than ever, net revenues are increasing, and expenses are holding steady. Compensation is seeing mixed results between management and production positions and has essentially caught back up to prerecession rates. The financial position of the A/E industry, as interpreted through various financial metrics, is positive and High-Performing Firms demonstrate “what’s possible” in the A/E markets—don’t settle for being median.
By understanding the overall financial position of the A/E industry (at the median level of performance), you can use that knowledge as you consider your firm’s compensation strategy. Cash compensation is only one spoke in the wheel when it comes to employee engagement and attracting and retaining staff; however, making
sure staff is paid adequately and fairly is fundamental to keeping your firm in the running for talent.
Note: This article was published in ASHRAE Journal, February 2016. Data included in this article is from the 2015 editions of PSMJ's A/E Financial Performance Benchmark Survey Report and A/E Management Compensation Benchmark Survey Report. Look here for Kate's update to this article with 2016 data later this year.
About the Author: Kate Allen, P.E., provides strategic direction and leadership for all of PSMJ's popular benchmark survey reports and is also a PSMJ consultant, primarily focusing on strategic planning, business valuation, and ownership transition planning. Kate is a frequent speaker at PSMJ's seminars and conferences and contributes regularly to PSMJ's journals and other publications.
With thousands of in-depth statistics, plus advice and commentary from our renowned consultants, PSMJ's benchmarking survey reports go beyond the hard data to give you the entire benchmarking picture you need to build a compelling business case for change.
The 2016 Survey Reports Are Now Available!


