 Where to start if you have a business unit that is under performing? Be sure to start at the top!
More specifically, start at the “topline,” which in the financial world refers to a firm’s revenue, the top line of the basic income statement.
Analyzing Business Unit Performance Using Net Revenue Capacity Modeling
Many architecture and engineering firms’ “topline” includes subconsultants and reimbursable expenses and is sometimes referred to as “total fees” or “gross revenue.” When modeling a business unit, you should be primarily concerned with what your staff can invoice (excluding reimbursable expenses) for their time and effort, which is referred to as “net revenue.”
By estimating the net revenue capacity (net revenue does not include subconsultants or reimbursable expenses) for each person as well as for the overall business unit you are forecasting anticipated billings. The details of the model will help you set clear expectations for each person within a unit and each business unit within a firm, and often brings some important questions to light:
• Can your business unit generate enough net revenue to meet the goals in the model?
• Is your target direct labor multiplier high enough to provide for profit?
• Is your business unit generating enough work for employees to reach their chargeability goals?
These are just a few issues that the model can help a business unit leader better understand and determine the appropriate action needed to change an underperforming business unit into a business unit that outperforms their goals and contributes at the highest level to overall firm success!
How to Put This Method Into Action:
Step 1: Determine Total Net Revenue Capacity
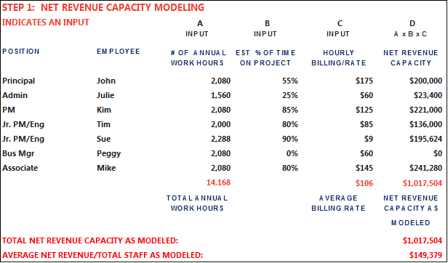
A Net Revenue Capacity Model is based on: the number of annual work hours anticipated for each person, with full-time estimated to be 2,080 hours in a year (Input A in the example below); the percentage of time that each person in the unit is expected to be working on project work, which is also referred to as the labor utilization rate or chargeability (Input B); and billing rate (Input C).When multiplied together, these metrics provide an overall net revenue target for the business unit (see the blue shaded section at the bottom of Step 1).

Step 2: Allocate Labor Costs
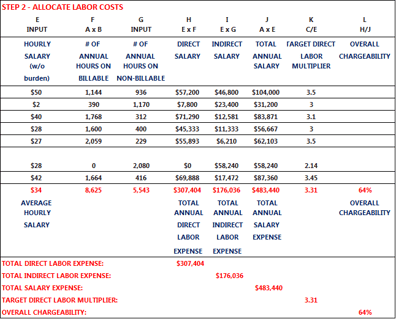
You can take Step 1 further by including the hourly salary (raw labor without burden) for each person in the business unit as well (Input E in the example below). By adding hourly salary, a natural byproduct of this analysis will include allocation of raw labor costs (see Step 2 below). Based on each person’s utilization, their base salary will either be allocated to direct labor (time spent on projects) or indirect labor (time spent on non-project work). And dividing net revenue capacity by direct labor costs results in a target direct labor multiplier, which can be easily determined for each person as well as the business unit.

Modeling Results Can Support Your Business Case & Assist with Top-Down Budgeting
Net Revenue Capacity Modeling helps to clearly set expectations for each person within a unit and each business unit within a firm and is the first step in top-down budgeting. Many business unit leaders may challenge the values used as inputs to the model; however, industry benchmarking by peer group(s)is an excellent way to further evaluate the model and defend your decisions with objective and
Monitoring Progress on a Monthly Basis
Once you’ve established the model, you can use it to compare your monthly results by simply dividing the net revenue totals for each person and the business unit by 12. This approach allows you to be proactively managing the business unit’s progress and make mid-course corrections if needed to make sure you’re on track to meet or beat your goals.
 Financials are the ultimate scorecard! PSMJ’s 2016 A/E Financial Performance Benchmark Survey Report contains the detailed information that your architecture or engineering firm needs to thrive in today’s economy. In fact, we use a variety of key performance metrics from this report to select PSMJ’s prestigious Circle of Excellence,an elite group of the industry’s most successful firms!
You also might be interested in these benchmarking-related blog posts:
Is Your Benchmarking Giving You the Right Answer?
Million Dollar Question: Why Benchmark?
Need to Know: COE Firms Benchmark for Financial Growth
Are You Setting High Goals For Staff Compensation?
Data Dive: How Financial Performance Impacts Your Compensation Options
The War for Talent: Does Your Compensation Strategy Measure Up?
Trend Line: Larger Firm Equals Larger Compensation


