|
CHOOSE THE 2023 PDF REPORT OR THE ALL-NEW EXCEL-BASED BENCHMARKING MODEL. OR SAVE $587 WHEN YOU GET BOTH!
|
||||||||||||||||||
| OPTION 2: The Model | |
|
2023 A/E Financial Performance Benchmark Model |
| Format: Excel-based Application Date Published: 2023 Price: $787 |
|

| OPTION 3: The COMBO! | |
|
A/E Financial Performance Benchmark Report AND Model COMBO: You save $587! |
| Format: PDF plus Excel-based Application Date Published: 2023 Price: $987 (a $587 savings!) |
|
Unless you don’t have a single competitor, you need to benchmark your architecture or engineering firm’s financial and operating performance.
How does your backlog compare to architecture or engineering firms of similar size, type, or market sector served? How fast is cash being collected in the industry today? How chargeable should your staff be and are you carrying too much labor overhead?
Only the highest quality data drives the highest quality decisions.
PSMJ’s 2023 A/E financial performance benchmark survey data, available in your choice of PDF Report or our new Excel-based Benchmarking Model, puts the answers to mission-critical questions (and many more!) at your fingertips. No other business intelligence resources contain this level of detailed information that your architecture or engineering firm needs to thrive. In fact, we use key performance metrics from this report to select PSMJ’s prestigious Circle of Excellence, an elite group of the industry’s most successful firms.
Both the Report and the Model contain hundreds of metrics that you can benchmark against, including:
|
|
|
|
|
|
|
|
|
|
|
|
|
|
|
|
If your strategic decisions aren't delivering the results you expect, go beyond the basics and get comprehensive detailed information that you can use. Both PSMJ’s A/E Financial Performance Benchmark Survey Report and A/E Financial Performance Benchmark Survey Model reveal the key financial metrics from top-performing firms, allowing you to drill down to peer groups based on firm size, type, geographic location, and even client types and market sectors!

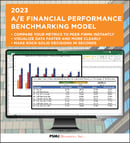
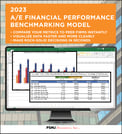
NEW! 2023 A/E Financial Performance Benchmarking Model contains ALL the current data in the PDF report PLUS it gives you an INSTANT look at how you compare to both peer firms and A/E/C Circle of Excellence® winning firms for hundreds of business function metrics!
Want to see how your firm's financial performance stacks up against firms your size, in your region, serving your markets, and with similar headcount -- INSTANTLY? Which of your KPIs reveal previously hidden "profitability killers" that drag down your bottom line? Ready to turn the industry's most current, complete, and accurate survey data into compelling charts and graphs that bring your whole team on board with the most difficult yet transformative business management decisions?
Simply enter your firm's financial performance data into the new 2023 A/E Financial Performance Benchmarking Model and see where focused executive attention on incremental improvements will have an IMMEDIATE and outsized impact on your firm's performance.
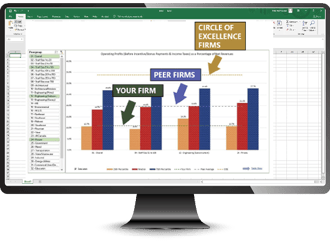
PSMJ's 2023 A/E Financial Performance Benchmarking Model makes it easy to compare your firm's performance to peer organizations on 100+ critical KPIs with just the click of the mouse
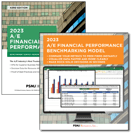
Example: Operating Profits (Before Incentive/Bonus Payments and Income Taxes) as a Percentage of Net Revenues
This intuitive, easy-to-master Excel-based application comes pre-loaded with ALL the data in our 2023 A/E Financial Performance Benchmark Survey Report. Using the Benchmarking Model, the most effective A/E leaders make policy and practice decisions that move the needle in the right direction, with clarifying charts and graphs to turn hard data into positive change.

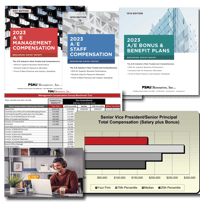
RELATED PRODUCTS
|
|
|
|
|
|