CompSUITE header image-1

Make smarter staff and management compensation decisions when you have the most current benchmarking data at your fingertips. PSMJ's annually-updated A/E Compensation Benchmarking Suite gives you everything you need to win A/E talent battles, optimize your largest expense, and keep your best people from looking elsewhere. 

A/E Compensation Benchmarking Suite unlocks our popular annual survey reports plus additional exclusive resources just for architecture and engineering firm leaders. 

  • Annual A/E Management Compensation Benchmark Survey Report: $787 Value
  • Annual A/E Staff Compensation Benchmark Survey Report: $787 Value
  • Bi-annual A/E Bonus & Benefit Plans Benchmark Survey Report: $787 Value
  • Excel-based Peer Firm Comparison Tools with A/E Compensation Inflation Adjustment Calculator and quarterly updates: $1,797 Value
  • Annual A/E Intern & Contract Labor compensation report: $197 Value
  • Annual A/E Compensation Strategy Snapshot: Get the latest projected pay increases, bonuses, and new position compensation changes: $247 Value


thisisengineering-raeng-TXxiFuQLBKQ-unsplash

Have CONFIDENCE in your compensation decisions

Your A/E Compensation Benchmarking Suite guides you to equitable employee pay, incentive, and bonus decisions using the industry's most trusted benchmarking data, with inflation adjustment tools to ensure you always get it right.

Accelerating inflation and a shrinking talent pool are driving up architecture and engineering firm payrolls. Think you need 10% pay bumps, big signing bonuses, and expensive incentives to keep pace in recruiting and retention? Not when you make decisions backed up by current data from peer firms, in your area, and serving your markets.

2023 HR Surveys covers-1

A/E Comp Benchmarking Data

What are peer firms in your region serving similar markets paying leaders and staff in base pay, bonuses, and benefits? You get PSMJ's annual Benchmark Survey Reports for A/E Management Compensation and A/E Staff Compensation, PLUS our bi-annual A/E Bonuses and Benefits report, each packed with the very latest industry data for 18 management roles and 66 staff positions.
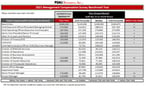
• Mgmt. Report Contents
• Sample Mgmt. Report Table
• Staff Report Contents
• Sample Staff Report Table
Tool Image

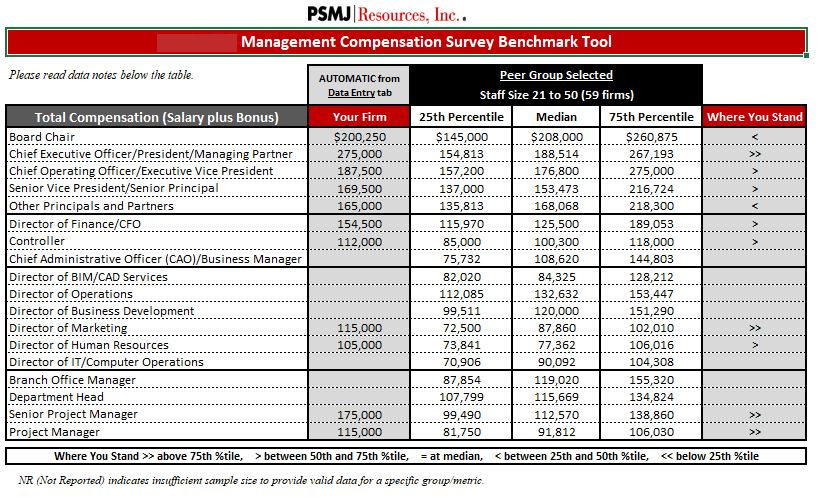
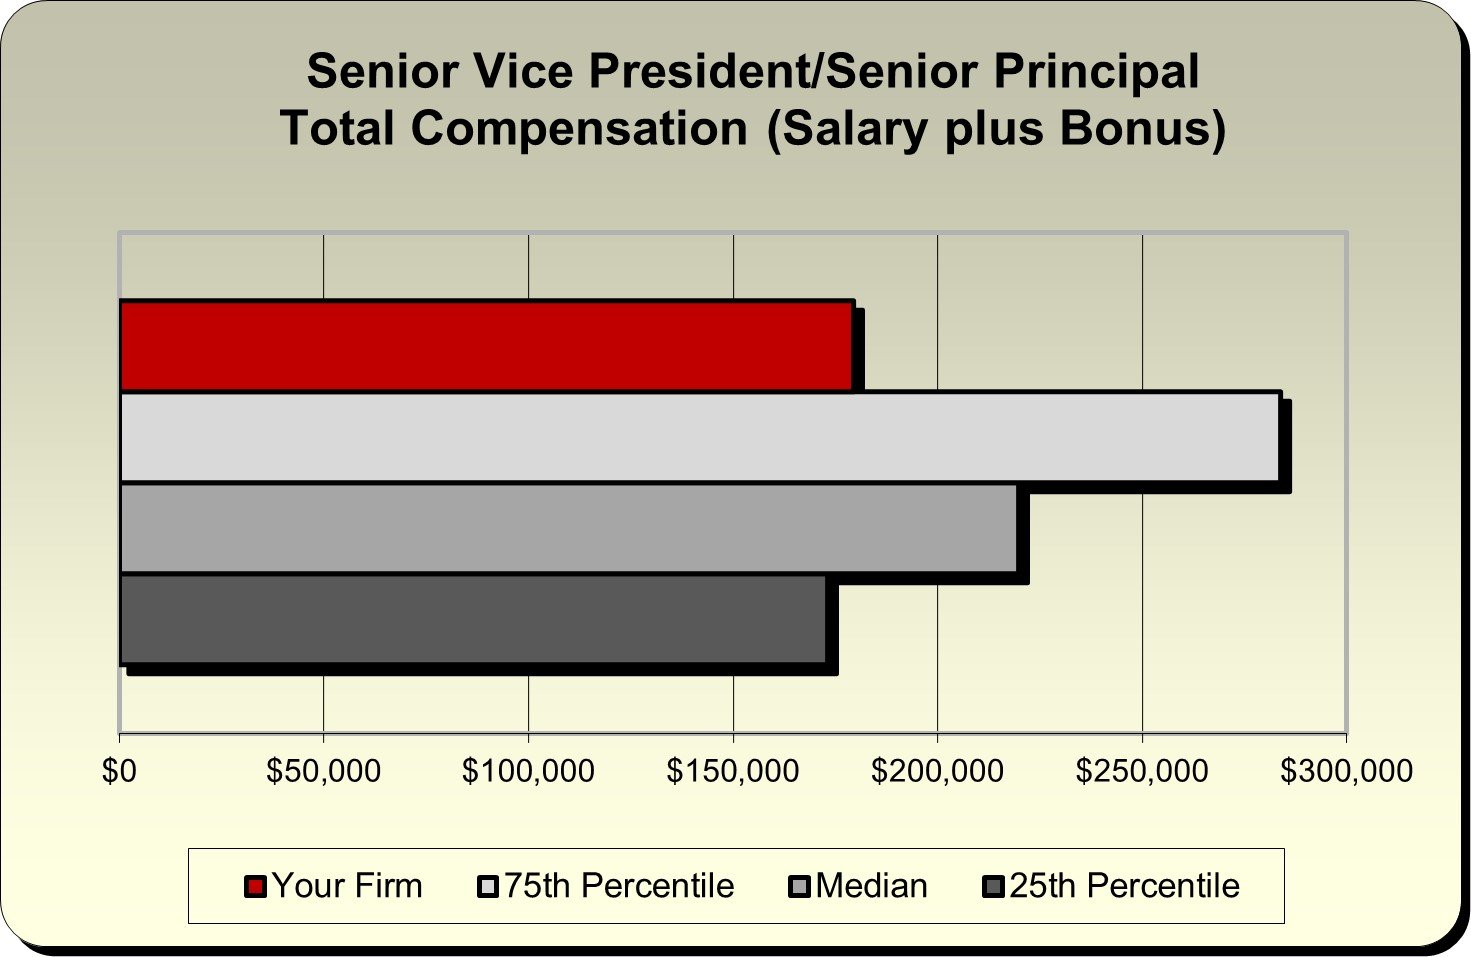
Excel-based A/E Peer Firm Comparison Tool

The A/E Compensation Benchmarking Suite's Peer Firm Comparison Tool turns your firm's salary figures into eye-opening position-by-position comparison charts showing where you're overpaying or underpaying relative to firms your size, in your area, and serving similar markets.

Simply enter base pay and bonus for every position and with one click get easy-to-read tables showing where you're paying over and under market rates.
hubspot-icon

A/E Comp Inflation Adjuster

Generic data more than 6 months old won't help you find that sweet spot between losing talent to a competitor's higher offer and busting budgets with overly generous pay practices.

That's why your A/E Compensation Benchmarking Suite includes a critical quarterly inflation adjuster that reveals when to offer increases and how much, based on the most recent data on price increases. Simply enter the rate and with one click, all your positions are updated.

You're paying WHAT? 

From entry-level architects and engineers to senior executives leading multiple teams and complex projects, everyone deserves to be paid fairly. Yet without the latest A/E industry data, you're forced to make base pay, incentive, bonus, and raise offers using generic BLS numbers, anecdotal evidence of dubious accuracy, and "gut-feelings" that can wildly miss the mark. Only the A/E Compensation Benchmarking Suite from PSMJ arms you with our industry's most accurate and current metrics, so you can back up every compensation decision with hard data based on hundreds of A/E executive survey responses. 

Management comp Tool Image
Tool Chart

It's great to see where you stand...

To get maximum return on your investment in human capital, you need to see how your management and staff compensation levels stack up against the competition. That's why A/E Compensation Benchmarking Suite's built-in tools turn your position-by-position payroll data into handy comparison charts, great for explaining strategy changes, pay increases, and how you compensate key contributors. 

  • Benchmark 66 A/E/C job titles
  • See where you stand against key percentiles

  • Make bulletproof strategic decisions based on hard inflation-adjusted data

A/E Compensation Deep Dive Data

Staff and Management Compensation Comparison Metrics For Every Position, All Instantly Available

A/E Compensation Benchmarking Suite provides you with staff and management compensation data, broken down by discipline and years of experience from entry level to 20+ years, for 84 different A/E firm positions, including:

  • Architects
  • Interior designers
  • Mechanical, electrical, structural, environmental and civil engineers
  • Scientists
  • Surveyors
  • Marketing
  • BIM/CAD staff
  • CEO
  • COO/Executive Vice President
  • CFO/Director of Finance
  • Senior Principal
  • Project Manager and Senior Project Manager
  • Controller
  • CAO/Business Manager
  • BIM/CAD Director


"This is one of the best data sets I have ever seen! Extremely valuable information in here. I hope you continue to do this one every year.”

Testimonial Image
Natalie Anderson, PHR, SHRM-CP
Human Resources Director | Banning Engineering

Need data now? Download our 2022 Reports.

To purchase just the A/E Management Compensation Benchmark Survey Report, click here.
To purchase just the A/E Staff Compensation Benchmark Survey Report, click here.