|
2022 A/E Compensation Publisher: PSMJ Resources, Inc. TOTAL Number of Pages: 1150 Format: PDF BUNDLE PRICE: $1099 YOU SAVE $275! Or, Upgrade for Even More Value: NEW! A/E Compensation Benchmarking Suite gives you both surveys PLUS inflation-adjustment and peer firm comparison tools, bonus compensation survey reports for temps, contractors, and interns, year-end increases, and so much more! Learn more. |

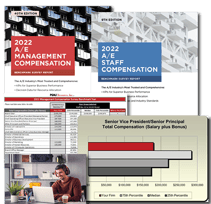
For a complete picture of peer firm management and staff compensation practices, get the 2022 A/E Compensation Benchmark Survey Report Bundle. You get two full reports, packed with exclusive industry and peer-level data for salary, bonus, total direct compensation, time allocations, billing rates, and much more for 84 A/E jobs!
Your bundle contains:
 2022 A/E Management Compensation Benchmark Survey Report
The newest A/E Management Compensation Benchmark Survey Report provides you with comprehensive industry data for establishing a compensation plan that includes everything from healthcare costs to fringe benefits, salaries, and bonus amounts for 18 management roles working in private and government sectors. These roles may be filled by architects, engineers or other professional/technical staff.
Data for this report is broken down by firm size, firm type, and client type. Peer group data is dependent on the number of participants for each position.
Table of Contents Sample Tables List of Positions
PLUS
 2022 A/E Staff Compensation Benchmark Survey Report
The 9th edition of our A/E Staff Compensation Benchmark Survey Report provides data based on discipline and years of experience from entry level to 20+ years for 66 common A/E firm positions including: architects; interior designers; mechanical, electrical, structural, environmental and civil engineers; scientists; surveyors; marketing and BIM/CAD, and more. The comprehensive industry report includes key results from salaries and bonus amounts to time allocation and billing rates for each position.
You get data broken down by firm size, region, and client type. Peer group data is dependent on the number of participants for each position.
Table of Contents Sample Tables List of Positions
RELATED PRODUCTS
|
|
|
|
|
|
|

