Is your firm vulnerable to talent poaching as the market for top talent heats up?
|
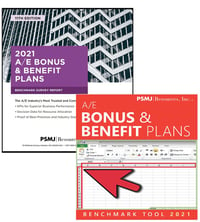
A/E Bonus & Benefit Plans Publisher: PSMJ Resources, Inc. Date Published: 2021 Number of Pages: 386 Format: PDF Price: $687 A/E Bonus & Benefit Plans Benchmark Survey Report + Tool Bundle
Looking for a previous year survey to support litigation or other research? For previous versions of PSMJ surveys contact Diane at dconstantine@psmj.com or call (617) 965-0055. |
INCLUDES 30 PAGES OF ALL-NEW
COVID-19 IMPACT DATA!
In this economy, architecture and engineering recruiters are chasing your star employees, so retaining them is mission-critical. Is your bonus and benefits package up to the task?
Incentive compensation and benefit package design is where many A/E firms struggle, operating on hunches, outmoded thinking, overheard anecdotes, rumors, and fuzzy math. Get this wrong and the good employees leave while the bad ones stay.
Make smart benefits and bonus decisions using the hard data and plain English analysis you get in the fully updated and expanded 2021 A/E Bonus & Benefit Plans Benchmark Survey Report.
"This is one of the best data sets I have ever received! Extremely valuable information in here."
Natalie Anderson, PHR, SHRM-CP
Human Resources Director
Banning Engineering
Current and prospective employees compare your bonus and benefits to the competition -- so support your decisions with current data
You can benchmark base salaries to ensure your pay scales are calibrated to the market, but to remain competitive and reduce turnover, you need to know what other firms in your region and market offer in bonuses and benefits.
PSMJ’s 2021 A/E Bonus & Benefit Plans Benchmark Survey Report digs deep to show you exactly when, where, and how the architecture and engineering industry’s top firms use bonus and benefits policies to keep critical performers engaged and productive -- and poach talent from other firms. It turns our exhaustive 300-question, 250-firm survey into use-it-now data and analysis you can use to adjust practices, meet vital employee retention and performance objectives, and avoid overspending.
You get the latest data on:
- Bonus levels and ranges as a percentage of total payroll
- Bonus levels and ranges as a percentage of company revenue
- Factors that drive bonus levels and eligibility
- Bonus timing and form to maximize impact and preserve cash flow
- Project, signing, and referral bonus amounts
- Working from home
- PTO and leave policies
- Health insurance contributions
- Life insurance, disability insurance, and wellness programs
- Diversity, equity and inclusion programs
- Tuition reimbursement
- Employee turnover rates
- Retirement plan contribution levels
- Performance and salary review models
- Transportation benefits
Plus, we've included new data for 2021 about COVID-19's impact on everything from retirement and benefit plans to company policies and working from home.
Our data is broken down by firm size, firm type, region, and client type. Peer group data is dependent on the number of participants for each group.
Did you participate in PSMJ's 2021 A/E Bonus & Benefits Plans Benchmark Survey? Be sure to get your discount by purchasing through the link you received via email. If you didn't receive the link, contact us at customerservice@psmj.com.
RELATED PRODUCTS
|
|
|
|
|
|
|


