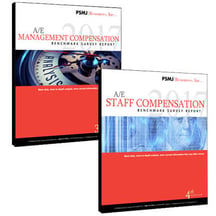
 Today, the need to attract and retain high performing employees is at an all-time high, yet reliable architecture and engineering industry compensation data is difficult to find. Consequently, PSMJ Resources, Inc. announces the official release of two important compensation surveys, thus enabling members of the A/E community access to comprehensive, compelling benchmark data specific to the industry.
PSMJ has launched its 2017 A/E Management Compensation Survey Report, 35th Edition and 2017 A/E Staff Compensation Survey Report, 4th Edition. In addition, PSMJ provides its recently released 2017 A/E Bonus & Benefits Benchmark Survey Report, and its soon-to-be released 2017 A/E Financial Performance Benchmark Survey Report.
PSMJ’s 2017 A/E Management Salary Survey Report includes the participation of 191 architecture and engineering firms, and reflects the compensation of nearly 7,500 individual design managers. This information was collected in January and February 2017, and reflects the most current salary, bonuses and total compensation measures for 18 design management titles. The survey provides breakdowns of these compensation measures within important peer groups reflecting different firm sizes, types of service, and types of client.
PSMJ's 2017 A/E Staff Compensation Benchmark Survey Report provides detailed compensation data for 48 professional staff and technical positions based simply on discipline and years of experience. Data are also analyzed by peer group such as firm size, region, and source of work for each position. This information was collected in March and April 2017.
“We developed our benchmark surveys in response to the specific needs of A/E industry firms,” says PSMJ’s Senior Principal Dave Burstein, P.E. “Together, these two surveys provide key compensation and HR benchmark data for professional and technical staff. “This is not simply competitive research but a way to align a firm’s compensation objectives with known, reachable goals.”
Trend information from PSMJ’s 2017 A/E Management Compensation Survey Report, for example, indicates interesting shifts among certain architecture and engineering firm management positions on the percentage of time charged to projects. While the overall results are somewhat similar to last year’s, noticeable shifts did occur among certain positions. For six out of 18 management positions, the percentages of time charged to projects decreased slightly in comparison to the levels reported in the 2016 survey.
Meanwhile, PSMJ’s 2017 A/E Staff Compensation Benchmark Survey Report specifies, for instance, the salary, bonus, and total direct compensation achieved at the top 10% of participating firms (the 90th percentile of the survey data), for those individuals with 20+ Years of Experience. This means 10% of the individuals receive compensation at this level or higher. Such high levels of compensation demonstrate that a design firm can be operated at an economically rewarding level and individuals can receive significant levels of personal compensation.
 PSMJ’s 2017 A/E Management Compensation Survey Report, 35th Edition and 2017 A/E Staff Compensation Survey Report, 4th Edition are available individually or as a bundle.
You also might be interested in these related PSMJ blog posts:
Is Your Benchmarking Giving You the Right Answer?
Need to Know: COE Firms Benchmark for Financial Growth
Data Dive: How Financial Performance Impacts Your Compensation Options
The War for Talent: Does Your Compensation Strategy Measure Up?


