|
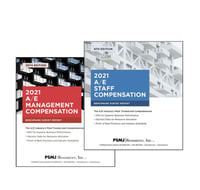
A/E Management Compensation Publisher: PSMJ Resources, Inc. Date Published: 2021 Number of Pages: 350 Format: PDF A/E Staff Compensation Benchmark Survey Report Publisher: PSMJ Resources, Inc. Date Published: 2021 Number of Pages: 650 Format: PDF A/E Financial Performance Benchmark Survey Report Publisher: PSMJ Resources, Inc. Date Published: 2021 Number of Pages: 329 Format: PDF A/E Bonus & Benefit Plans Publisher: PSMJ Resources, Inc. Date Published: 2021 Number of Pages: 386 Format: PDF |
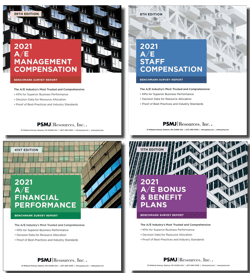
These FOUR comprehensive reports provide a wealth of exclusive industry and peer-level data for salary, bonus, total direct compensation, time allocations, billing rates, and much more.
Our 39th edition of PSMJ’s A/E Management Compensation Benchmark Survey Report covers 18 management roles from chairman of the board to PM.
The 8th edition of the A/E Staff Compensation Benchmark Survey Report covers 60 staff positions by years of experience, from architects and mechanical, electrical, and civil engineers to CAD and marketing staff.
The 11th edition of the A/E Bonus & Benefits Plans Survey Report turns our exhaustive 300-question, 250-firm survey into use-it-now data and analysis you can use to adjust practices, meet vital employee retention and performance objectives, and avoid overspending.
Our 41st edition of PSMJ's A/E Financial Performance Benchmark Survey Report contains the detailed information that your architecture or engineering firm needs to thrive in today’s economy.
Together, these four reports give you the critical information you need to analyze your firm’s compensation and benefits strategy. When you purchase the complete 2021 A/E Benchmark Survey Reports Bundle, you save more than $700 and get:
2021 A/E Management Compensation Benchmark Survey Report
The PSMJ Management Compensation Benchmark Survey Report provides you with comprehensive industry data on establishing a compensation plan that includes everything from healthcare costs to fringe benefits, salaries, and bonus amounts for 18 management roles working in private and government sectors. These roles may be filled by architects, engineers or other professional/technical staff.
Data for this report is broken down by firm size, firm type, and client type. Peer group data is dependent on the number of participants for each position.
ADDITIONAL DETAILS
2021 A/E Staff Compensation Benchmark Survey Report
This compensation study provides data based on discipline and years of experience from entry level to 20+ years for common A/E firm positions including: architects; interior designers; mechanical, electrical, structural, environmental and civil engineers; scientists; marketing and CADD staff; and more. The comprehensive industry report includes key results from salaries and bonus amounts to time allocation and billing rates for each position.
Data for this report is broken down by firm size, region, and client type. Peer group data is dependent on the number of participants for each position.
ADDITIONAL DETAILS
2021 A/E Bonus & Benefits Plans Survey Report
PSMJ’s 2021 A/E Bonus & Benefit Plans Benchmark Survey Report digs deep to show you exactly when, where, and how the architecture and engineering industry’s top firms use bonus and benefits policies to keep critical performers engaged and productive -- and poach talent from other firms. It turns our exhaustive 300-question, 250-firm survey into use-it-now data and analysis you can use to adjust practices, meet vital employee retention and performance objectives, and avoid overspending.
Data for this report is broken down by firm size, firm type, region, and client type. Peer group data is dependent on the number of participants for each group.
ADDITIONAL DETAILS
2021 A/E Financial Performance Benchmark Survey Report
Go beyond the basics and get comprehensive detailed information that you can use. PSMJ’s financial performance survey data drills down to peer groups based on firm size, type, geographic location, and even client types and market sectors! Want to see how architecture or engineering firms focused on the private sector compare to those in the public sector? Find it here. Looking for data that is most relevant for your firm focused on the transportation sector versus the housing market? It is all here.
ADDITIONAL DETAILS
RELATED PRODUCTS
|
|
|
|
|
|
|


