|
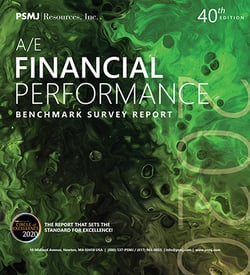
A/E Financial Performance Publisher: PSMJ Resources, Inc. Date Published: 2020 Number of Pages: 329 Availability: In Stock Format: PDF Price: $587 For previous versions of this survey contact Diane Constantine at dconstantine@psmj.com or call (617) 965-0055.A/E Financial Performance Benchmark Survey Bundle
Survey Report + Benchmark Tool = Save big and get even more value from your Survey Report when you bundle it with PSMJ's A/E Financial Performance Benchmark Tool. The Benchmark Tool, provides sophisticated MS Excel spreadsheets that make it easy to compare your firm’s financial performance against firms of similar size, service, client type, and market. Just input your firm’s data, and instantly get a clear, objective look at where your firm stands, using the latest benchmarking indicators. |

SEE BELOW FOR A SPECIAL LIMITED TIME BONUS OFFER!
Only the highest quality data can help you to make the highest quality strategic decisions.
Unless you don’t have a single competitor, you need to be benchmarking your architecture or engineering firm’s financial and operating performance. Where do you excel and where do you fall short compared to architecture or engineering firms of similar size, type, or market sector served? Do your strategic initiatives deliver the results you expect? How fast is cash being collected in the industry today? How chargeable should your staff be and are you carrying too much labor overhead?
PSMJ’s 2020 A/E Financial Performance Benchmark Survey Report puts the answers to these questions (and many more!) at your fingertips. No other product contains the detailed information that your architecture or engineering firm needs to thrive in today’s economy. In fact, we use a variety of key performance metrics from this report to select PSMJ’s prestigious Circle of Excellence, an elite group of the industry’s most successful firms!
Only the best benchmarking data is:
- Vetted. Our data is gathered through an in-depth survey that is scrubbed against a series of error traps and reviewed from multiple angles for reasonableness.
- Unbiased. Our data is provided by hundreds of independent sources. That means a higher degree of confidence that the information is current and accurate.
- Comprehensive. Our data is way more than just simple financial stats. This report digs deep with key operating metric data and ratios you can’t find anywhere else.
LIMITED TIME BONUS OFFER:
Purchase your copy of PSMJ's 2020 A/E Financial Performance Benchmark Survey Report and you get the industry's best benchmark data PLUS these two valuable bonus resources:
1. A FREE COVID-19 IMPACT SNAPSHOT REPORT (A $47 VALUE)! This new supplemental report shows how and where COVID-19 has disrupted the performance of peer A/E firms on a selection of key metrics...with data that as just collected!
2. FREE EXCLUSIVE ACCESS TO THE LIVE BROADCAST "Are You Faring Better than Peer Firms … or Worse?" (A $197 VALUE) on August 28th where PSMJ Senior Consultant Dave Burstein, P.E. walks you through how to interpret and act on PSMJ's COVID-19 impact data. How have things changed? How have they changed? How should I adjust my strategy and budget accordingly? Get unvarnished and action-oriented answers right here!
After completing your purchase of the 2020 A/E Financial Performance Benchmark Survey Report, we'll rush you details for accessing this bonus content!
The supplemental report, sent to you in August 2020, is yours FREE with your order of the 2020 A/E Financial Performance Benchmark Survey Report!
The value-packed 2020 A/E Financial Performance Benchmark Survey Report contains more than 100 metrics that you can benchmark against, including:
- Operating profit
- Labor utilization rate
- Target and achieved net direct labor multiplier
- Direct labor costs per direct labor hour (including data by state)
- Operating overhead rate (including data by state and in FAR format)
- Bonus/Incentive payments as a percentage of direct labor
- Accounts receivable collection rate
- Average work-in-process days
- Return on equity
- Line of credit as a percentage of net revenue
- Current ratio (with and without deferred tax liabilities included)
- Net revenue backlog change from previous year (including data by state)
- Staff ratios, size change, and turnover rates
- Net revenue per total staff, technical staff, and other functional areas
- Key historical trends and insight
- And much more!
Go beyond the basics and get comprehensive detailed information that you can use. PSMJ’s financial performance survey data drills down to peer groups based on firm size, type, geographic location, and even client types and market sectors! Want to see how architecture or engineering firms focused on the private sector compare to those in the public sector? Find it here. Looking for data that is most relevant for your firm focused on the transportation sector versus the housing market? It is all here.
*Our data is broken down by firm, region, client type, and market sector. Peer group data is dependent on the number of participants for each category.
RELATED PRODUCTS
|
|
|
|


