

Is it an anomaly or the start of an encouraging trend? The latest Quarterly Market Forecast data from PSMJ Resources, Inc. shows that we may have the worst behind us on slowing proposal activity.
The overall A/E/C outlook made an abrupt pivot upwards from a downward trend driven largely by the freefall that was happening in key private-sector markets. PSMJ’s latest Quarterly Market Forecast survey of 187 A/E/C executives (collected between April 5, 2023 and April 13, 2023) revealed an overall proposal activity Net Plus/Minus Index (NPMI) value of 32.8, which marks a significant rebound from just 8.0 at the start of 2023. Any NPMI value above zero indicates that more respondents are seeing an increase in proposal activity compared to the prior quarter (+100 indicates all respondents are seeing an increase in proposal activity, -100 indicates all respondents are seeing a decrease in proposal activity). Since proposal activity is a leading indicator for backlog, revenue, and—ultimately—cash flow, the latest NPMI values provide a valuable glimpse into cash flow over the next 12 to 24 months.
While we haven’t rebounded to the high water mark of 60.2 in at the start of 2022, this is a very encouraging sign after a downward trend with each quarterly survey throughout 2022. According to PSMJ President Gregory Hart, this latest data is very encouraging.
“We’ve been looking for the bottom on proposal activity sentiment – particularly in the housing market–for the past year and I hope that we’ve found it and are able to start to put significant near-term recession fears behind us. Of course, one data point is not a trend and we still have to contend with rising interest rates, potentially tightening lending standards, and some political uncertainties at the global level,” states Hart. “But, if you have significant exposure to the private land development markets in your revenue mix, this is a welcome sign.” The following chart compares the NPMI values in each client to the same period last year:
Based on our latest Quarterly Market Forecast data, the following chart summarizes the year-over-year market movement in each of the 12 major client markets:
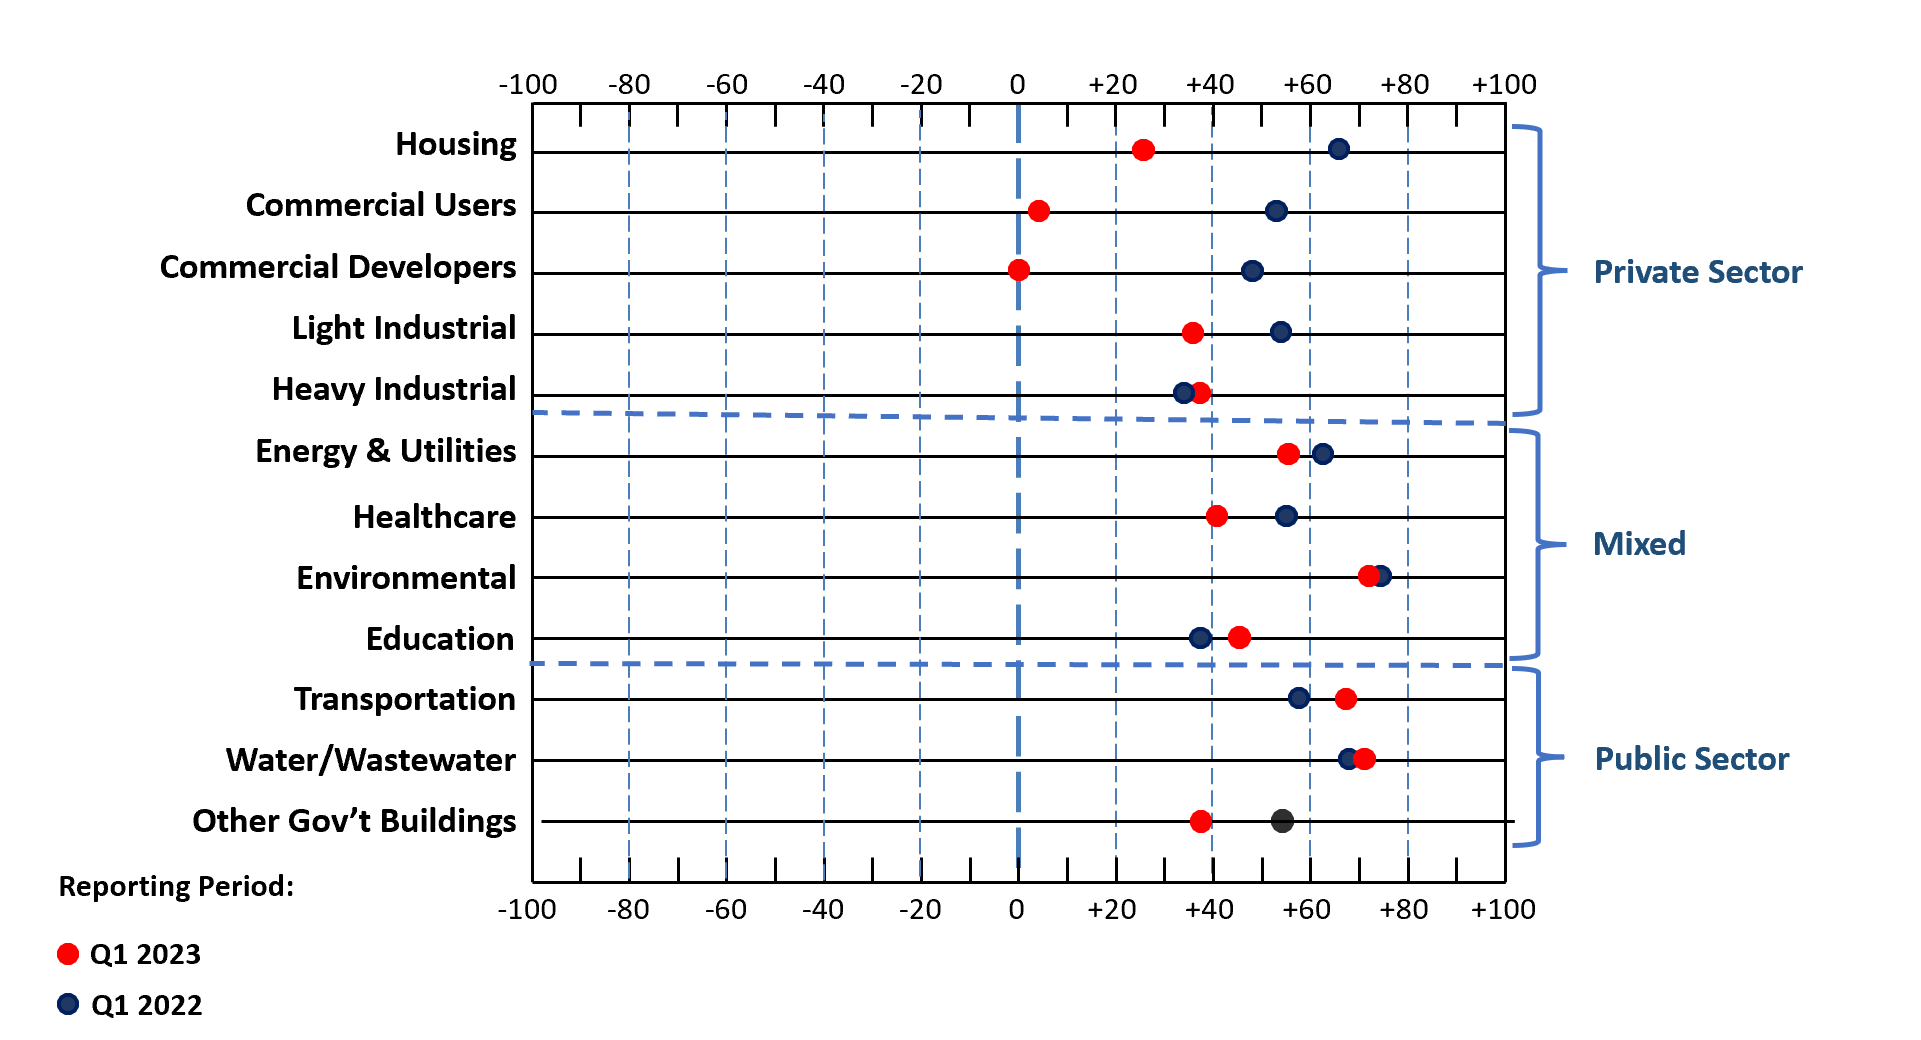
The following markets are showing the strongest NPMI values in the latest survey:
Environmental 71.4
Water/Wastewater 70.8
Transportation 65.5
Energy/Utilities 55.1
Education 42.2
Want the complete Quarterly Market Forecast report delivered to your inbox every quarter? Become a PSMJ PRO member today and join thousands of A/E/C firm leaders who access this and many other great benefits such as the monthly PSMJ Journal, monthly live broadcast of The $10,000 Hour, leadership discussion forum and much more! Just one good idea will pay for your annual membership fee many times over!

![]()