When architecture/engineering/construction market trends change (either positively or negatively), this is observed first as a change in the number of available proposal opportunities. These changes in proposal opportunities later become changes in backlog, revenues, and cash flow. Thus, increasing proposal activity generally indicates a good growth market, and thus the greatest opportunity for firms looking to grow.
Since 2003, PSMJ has been conducting quarterly surveys to assess the strength of all the major A/E/C markets. These surveys are conducted during the months of March, June, September, and December. In the surveys, we ask the following questions comparing the current quarter to the previous quarter:
-
Did your firm’s revenues increase or decrease? If so, were the increases/decreases more than 5% or less than 5%?
-
Did your firm’s backlog increase or decrease? If so, were the increases/decreases more than 5% or less than 5%?
-
Did the number of proposal opportunities increase or decrease?
-
What are your expectations for next quarter’s revenues? Do you expect them to increase or decrease? By more than 5% or less than 5%?
PSMJ’s Quarterly Market Forecast report tracks these indicators and present them in a quarterly update. We also ask questions about the respondents’ markets, submarkets, and geographic regions.
The responses we receive allow us to compute a Net Plus/Minus Index (NPMI) by subtracting the number of respondents who responded negatively from the number who responded positively. If the same number responded positively and negatively, the plus-minus index would be 0. If more responded positively, the index would be positive. And if more responded negatively, the index would be negative. The higher the positive or negative value of the index, the stronger the positive or negative response.
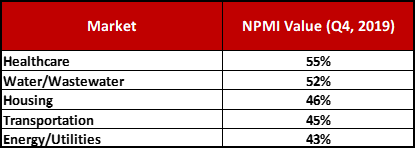
It also provides new data illustrating the current top five “hot” markets in terms of the highest Net Plus/Minus Index (NPMI) values on proposal activity. Based on the data collected for this report, the “hot” market segments represent the areas that have the highest portion of firms indicating that proposal activity is increasing. More specifically, we have drilled into what specific submarkets appear to be showing the strongest proposal activity.
For the 2019 Q4 report, the five “hottest” market segments are:

Of course, many other markets are also reporting positive growth of proposals. For more detailed information, download a copy of PSMJ's Quarterly Market Forecast.
The full report is available in three ways:
-
Participate and get it free (a $347 value).
-
Become a PSMJ member and get it (and lots of other stuff) with your membership.
-
Purchase it for $347.
For more in-depth insight to the most recent Quarterly Market Forecast results, check out this PSMJ podcast:
 What: 2019 is Going Strong. How Positive are you about the A/E Optimism?
 U.S. and Canadian GDP has been growing steadily since The Great Recession. And 2019 continues the trend as the economy is going strong. Since 2003, PSMJ has asked A/E firm leaders every three months about their outlook for over 50 A/E markets and submarkets. Join your colleagues and PSMJ’s Dave Burstein for this 30-minute live podcast and learn:
• More about what PSMJ’s most recent Quarterly Market Forecast tells us about proposal activity and backlog trends in various sectors and geographic regions in North America.
• Why business in the A/E sector is brisk and why it will continue (at least for a while).
• Why the housing market is the best early indicator of what will happen in most other A/E market sectors.
• How to be part of the PSMJ’s Quarterly Market Forecast.


