 A key factor in an architecture or engineering firm’s ability to pay higher compensation and retain its staff is its ability to raise prices for its services. Changes to the firm’s billing rates are indicative of pricing sensitivity and the balance between supply and demand for design services.
In PSMJ’s AE Staff Compensation Benchmark Survey Report and AE Management Compensation Benchmark Survey Report, firms are requested to report the quoted hourly rate for all positions (i.e., proposed billing rates prior to contract negotiation).
Billing rates are heavily influenced by both level of experience and the current condition of the economy, and require periodic review as salaries and overhead costs change.
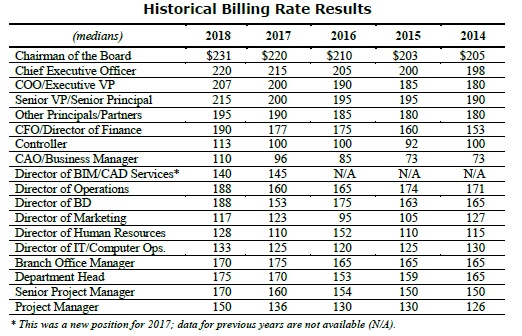
PSMJ’s AE Management Compensation Benchmark Survey Report presents the billing rates, the quoted hourly rate for each of the 18 positions that design firms have reported at the start of each of the past six years. According to the 2018 survey, billing rates for 14 of the 18 management positions in 2018 are equal to or slightly higher than the comparable 2017 findings (see chart below).
PSMJ's AE Staff Compensation Benchmark Survey Report provides the billing rates for each of the 48 positions that design firms have reported at the start of each of the past four years. According to the 2018 survey, billing rates for 46 of the 48 staff positions in 2018 are equal to or higher than the comparable 2017 findings.
Changes in billing rates should be considered when evaluating your base compensation for each position. Also, coupling billing rate data with key financial benchmarking data, such as achieved direct labor multipliers (which can be found in PSMJ’s annual AE Financial Performance Benchmark Survey Report), can provide additional insight into the performance of the overall AE industry.
Meanwhile, inflation, as measured by the Consumer Price Index, is up 2.1% between December 2015 and December 2016. In addition, the Employment Cost Index, a better measure of salary inflation, is up by 1.6% between December 2015 and December 2016, indicating that salaries are on the rise.
What is the take away: Comparing current data to your firm’s billing rates helps to ensure your potential salary changes, overhead, and profit are included in your billing rates.
If you would like to learn more about PSMJ's compensation benchmark survey reports, please click on the links below.
|
|
|