What if there was an easy way to find and fix salary anomalies in your architecture or engineering firm, standardize and right-size your payroll practices, and rein in compensation bloat?
|
A/E Compensation Equity Publisher: PSMJ Resources, Inc. Date Published: 2023 Format: MS Excel PLUS 1-hour of consultation with a PSMJ AEC Compensation Expert Price: $3,800
|
PSMJ's A/E Compensation Equity Model is the eye-opening Excel-based management tool that makes it easy for your architecture or engineering firm's executive leadership to compare individual staff and management salaries to both other employees in your firm and to industry norms, and identify who you're paying too much or too little.
This one-of-a-kind interactive analysis tool allows you to compare your staff salaries to the most up-to-date compensation information for executives, managers, architects, civil engineers, electrical engineers, mechanical engineers, structural engineers, environmental engineers, landscape architects, and more.
Simply enter each employee's compensation and demographic data, including location, gender, ethnicity, years of experience, hourly rate, and other information where instructed. The Model does the rest, comparing each employee's compensation to averages for their cohort, both within your firm and against peer firm averages.
To make it even easier to use the Model, your purchase includes 1 hour of one-on-one consultation with one of PSMJ's AEC compensation experts, via phone or teleconference!
Using the Model's easy-to-read charts, you can adjust your firm’s salary data based on the BLS for your city, use visuals to help determine how or if any salaries need to be adjusted, and gain valuable insight into billing rates and chargeability!
When you make comp decisions using PSMJ’s A/E Compensation Equity Model, you know:- All your technical/design professionals’ salaries and bonuses are internally equitable and in sync with the market
- You have eliminated gender or ethnicity bias in your compensation practices.
- Your managers’ compensation is in sync, both internally and externally
- Which of your staff and managers are contributing the most to your firm’s bottom line
- The exact impact of any planned salary increases on your firm’s revenues and profits
WE'VE DONE THE RESEARCH FOR YOU
PSMJ conducts statistical analysis on the factors that affect salaries of professional staff in the A/E industry, such as degrees conferred, years of experience, geographic location, and job performance are most important. Taken together, these factors have greater than a 95 percent correlation with actual salaries! Our A/E Compensation Equity Model allows you to simply select these factors from convenient drop-down menus for each firm employee and immediately see a graph of the results. All you do is fill out a simple spreadsheet.
Leveraging PSMJ's A/E Compensation Benchmark Survey data and U.S. Bureau of Labor Statistics wage index adjustments for hundreds of major metropolitan areas, plus data you input regarding your firm's compensation, the A/E Compensation Equity Model produces a graph showing each employee's actual salary and location-adjusted salary for each position in your firm. 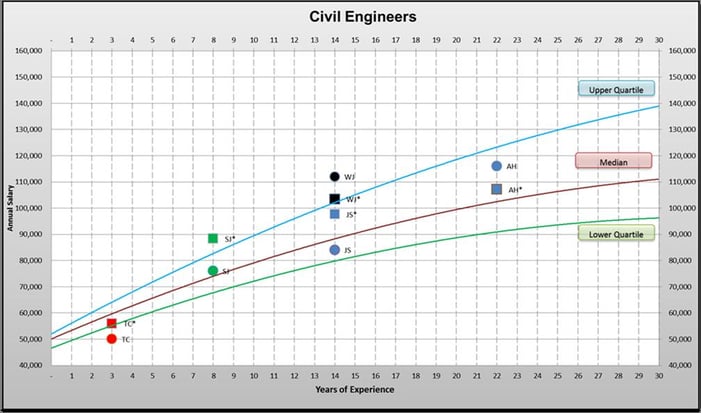
This unique Excel-based tool makes it easy to determine if:
- Your salaries are generally in line with norms
- Your top performers are underpaid
- Your firm is overpaying below-average performers
- Your pay policies show unconscious gender and racial bias
- Your salaries are competitive or out of range
| Common Problems With Traditional Compensation Analyses | How PSMJ’s A/E Compensation Equity Model Helps You Solve Them |
| Failing to Consider the Impacts of Increased Comp on Financial Performance. Competition for A/E talent is forcing firm leaders to increase employee compensation, yet clients are reluctant to grant big increases in billing rates or lump sum fees. So limiting your decision factors to labor market competitiveness isn’t enough. |
PSMJ’s A/E Compensation Equity Model benchmarks each employee’s performance against industry norms for key profit drivers like utilization, billing rate multiplier, and revenue factor. So you maintain your firm’s target profitability as you increase base salaries. |
| Equal Pay for Equal Work? Two A/E professionals with the same position description and experience but different degrees should be paid differently. Failing to recognize these this can result in overpaying some while underpaying others. |
Unlike some analyses that lump all engineers together into a common job class, PSMJ’s A/E Compensation Equity Model analyzes each discipline separately. This allows you to establish appropriate profiles for different seniority levels for each degree type. |
| Incorrectly Adjusting for Different Locations. A common method for adjusting compensation for different locations is the use of the Consumer Price Index. But PSMJ’s analysis reveals it often provides erroneous results by failing to acknowledge cost of living differences. |
PSMJ’s A/E Compensation Equity Model uses the most current wage indices from the U.S. Bureau of Labor Statistics to adjust for over 300 metropolitan areas across the U.S. So you always factor in the most reliable data when setting pay rates. |
| Not Accounting for Firm Size. Large firms pay significantly higher salaries for managers. Yet most compensation analyses rarely consider this, meaning you risk either overpayment or underpayment. |
PSMJ’s A/E Compensation Equity Model breaks survey benchmark data down by firm size, so your comparisons are always apples to apples. |
|
Not Addressing Gender and Ethnicity Inequities |
PSMJ’s A/E Compensation Equity Model uses sophisticated algorithms to compare salaries of White males to other groups based on gender and race/ethnicity to reveal unconscious bias and the impact of salary adjustments to remedy inequities. |
|
You Deal with a Firehose of Data. |
PSMJ’s A/E Compensation Equity Model gives you clear and concise graphical representations of your employee compensation situation, so you can easily grasp key takeaways and explain your decisions to employees. |
| No Support Most compensation surveys generate a report and leave it up to you to figure out how to apply it to your firm. |
Your purchase includes a 1-hour session with a PSMJ’s compensation consultant, to via phone or teleconference, to help you master the tool and use your findings. |
Traditional position descriptions (Engineer I, Engineer II, etc.) are okay for establishing billing rates and career steps but are not very effective for setting salaries. So A/E Compensation Equity Model incorporates more specific data points to describe each employee in detail and combines these factors, along with our updated compensation survey data and data from the Bureau of Labor Statistics, to benchmark employee compensation and ensure it’s in sync with the industry and internally equitable, while taking into account the impacts of any compensation changes on your firm's financial performance goals.
Now you can easily spot and amend pay inequities for key roles in you A/E firm, including:
| • Architect | • Landscape Architect | • Director Business Development |
| • Interior Designer | • Board Chair | • Director of Marketing |
| • Civil Engineer | • Chief Executive Officer | • Director of Human Resources |
| • Electrical Engineer | • COO/Executive VP | • Chief Technology Officer |
| • Mechanical Engineer | • Senior Vice President/Senior Principal | • Branch Office Manager |
| • Structural Engineer | • Other Principals and Partners | • Department Head |
| • Environmental Engineer | • CFO | • Senior Project Manager |
| • Scientist (Biologist, Chemist, Geologist, Environmental Scientist) | • Controller | • Project Manager |