
|
A/E Management Salary Equity Publisher: PSMJ Resources, Inc. Date Published: 2021 Format: Excel Price: $697
|
This one-of-a-kind, excel-based, interactive salary tool allows you to compare your staff salaries to the most up-to-date PSMJ information available today for chairman of the board, CEO, COO, and more.
But this tool does so much more! Using PSMJ's A/E 2021 Management Salary Equity Benchmarking Tool you can adjust your firm’s salary data based on the BLS for your city, use visuals to help determine how or if any salaries need to be adjusted, and gain valuable insight into billing rates, chargeability, and revenue forecasting!
WE DO ALL THE WORK
PSMJ conducts statistical analysis on the factors that affect salaries of managerial staff in the A/E industry. We find factors that are important, such as firm size, geographic location, and job performance. All you need to do is fill out a simple spreadsheet.
With your unique data, PSMJ’s A/E 2021 Management Salary Equity Benchmarking Tool produces a graph leveraging pre-loaded compensation data from PSMJ’s 2020 A/E Management Compensation Benchmark Survey Report as well as U.S. Bureau of Labor Statistics wage index adjustments for hundreds of major metropolitan areas.
The graph allows you to compare your salaries with median hourly rates for each position as well as upper and lower quartile. You are then able to adjust your costs to better align with professional performance, competitive advantage, and revenue goals.
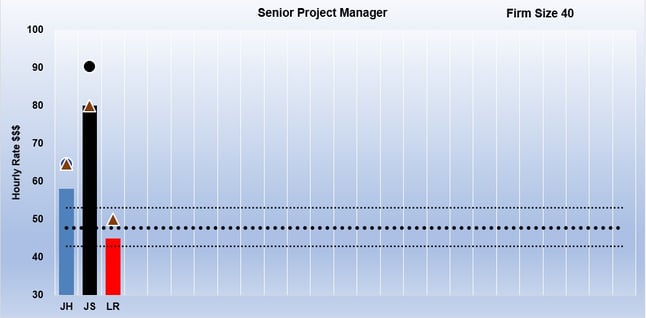
Using the tool, firm leadership can then determine if:
- The firm’s salaries for their leadership are generally in line with A/E industry norms
- If top performers are underpaid
- If the firm is overpaying below-average performers
But the best part of using this indispensable tool is that it produces high-quality and consistent results, that allow you to:
- Make decisions backed up by dependable, indisputable, and current data
- Generate information customized by geography, firm size, and current or prior year
- Back up revenue forecasting—since you build it on your own billable and chargeability targets
You can do all this work manually—but it would take hours to calculate what this tools does instantaneously, reliably, and consistently.
RELATED PRODUCTS
|
|