Has the economy improved for the A/E industry as predicted last year, and if so, will it be enough to allow firms to attract and retain key employees? Another year has passed and it’s time to once again use benchmarking data as a window into the overall financial condition of the A/E industry and its impact on compensation.
First, let’s go back to our findings from last year to get started. In the February 2014 issue of the ASHRAE Journal, the article “Pay for Engineers in the A/E Industry – Still on the Road to Recovery?” presented a discussion on cash compensation as it related to the overall financial health of the A/E industry, following the economic downturn of 2009. The intent of the article was to help both the engineer and the employer better understand the current financial position of the industry and how that was impacting compensation options, using A/E industry- specific benchmarking data.
The benchmarking data revealed that net revenues were rising slightly faster than expenses, and while overall profitability as a percentage of net revenues had improved (to a median of 11.4%), it still remained significantly below the 2007 high of 15.2% (median). The connection between base compensation and billing rates, as evidenced by target and achieved direct labor multipliers, of 3.10 and 3.02 respectively, was discussed as well, with emphasis on the impact of pricing (fees) and project management on overall profitability. The industry was improving but had not fully recovered from the recession in terms of profits and compensation rates. Overall, it appeared the A/E industry was poised for growth as the economy continued to improve.
With another year behind us, and new data at hand, let’s look at this year’s numbers to see where we stand and how much improvement the industry actually saw in the past year. The tables and figures that follow report the median for each metric, which is the midpoint of a set of data (not the average). There are many successful firms that outperform the industry “medians,” but the tables and figures that follow may be useful to begin comparing your firm’s performance.

The results are encouraging!
Net revenues and profits are continuing to rise faster than expenses and labor costs. Overhead, as a percentage of direct labor costs, is holding steady near 160%. Direct labor costs have increased 6% exceeding the growth of the consumer price index, with profits (earnings before bonuses, discretionary distributions, and taxes) increasing 14%. Balance sheets are improving as evidenced by the substantial amount of equity that firms are carrying per total staff, which increased from $21,666 to $31,659, between 2013 and 2014.
A detailed historical comparison of several of these key financial indicators is provided in Figure 1 and Table 2, below.
Figure 1: Historical Direct Labor Benchmark Trends
 Source: PSMJ’s 2014 Financial Performance Benchmark Survey Report

The great news is that the gap is closing between the target and the achieved direct labor multiplier, (see Figure 2). If the target is less than the achieved direct labor multiplier the result is a net revenue deficit (less profit than expected) which was a -1.6% median in 2014 results. If the target is greater than the achieved direct labor multiplier, the result is a net revenue surplus (higher profits than expected). The improved results in the figure below generally indicate that firms are achieving better fees for projects and/or those projects are being more efficiently managed, reducing the net revenue deficit.
Figure 2: Target versus Achieved Direct Labor Multiplier

 Source: PSMJ’s 2014 Financial Performance Benchmark Survey Report
Unfortunately the A/E industry is still struggling to earn a reasonable profit, but it’s headed in the right direction (see Figure 3 above) and has seen a gain of 36% since the low point in 2010.
Compensation Trends
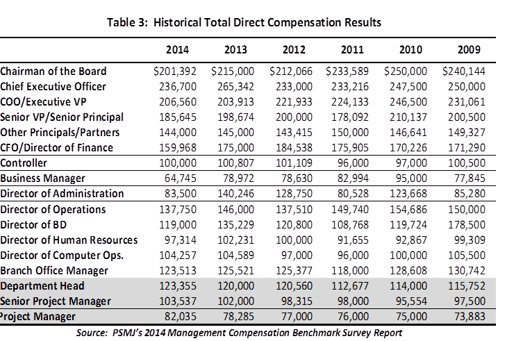
Annually, for the past 32 years, PSMJ Resources, Inc. has conducted a management compensation survey that solicits data from both engineering and architectural firms for 17 management positions, from chairman of the board to junior project manager. Historical Total Compensation is presented in Table 3 for the past 6 years. It’s important to note that compensation rates generally increase with firm size, so use the information in the table below with caution. The table is presented to demonstrate trends only, and for more detailed information a full compensation study would be needed.
Total compensation reached a 5-year high in the 2009/2010 time period but fell to a 5-year low in the 2011/2012 time period for most positions/roles. While total direct compensation for the majority of the senior level roles (Chairman of the Board, CEO, COO, etc.) has yet to recover to 2009 numbers, more production focused positions/roles have generally increased and have exceeded 2009 (Department Head, Senior Project Manager, and Project Manager).
Billing Rate Trends
Compensation is directly related to hourly billing rates, which are intended to recover all design firm costs (including direct labor and overhead) and provide for profit. For example, if a highly billable Senior Project Manager is paid $50 per hour (excludes labor burden or fringes), and the firm’s overhead rate is 160% on direct labor, then the breakeven billing rate would be $50 x (1+1.6) = $130 per hour; and a billing rate of $150 provides for about 13% profit. Reimbursable expenses are recovered from the client directly and not included in these billing rates. If compensation rates exceed what can be recovered in billing rates then profits may be negatively impacted.
Billing rates have been generally tracking with total compensation. Many of the senior level roles (COO and Senior VP) have yet to fully recover to pre-recession rates, while more production-oriented positions (Senior Project Manager, Project Manager) are above 2009 numbers, see Table 4.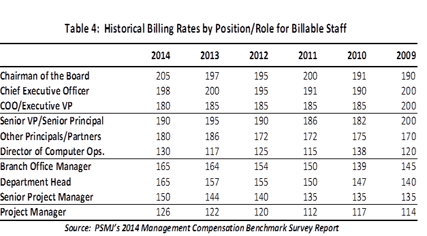
Conclusion
The numbers tell the story – the A/E industry is nearly fully recovered to pre-recession compensation and billing rates. The achieved direct labor multiplier is on the rise, net revenues are increasing, and expenses are holding steady. Employees are demanding salary increases, post-recession, and by understanding the overall financial position of the A/E industry (at the median level of performance) you can use that knowledge as you consider your firm’s compensation strategy – cash compensation is only one spoke in the wheel when it comes to employee engagement and attracting and retaining staff.
Note: This article was published in ASHRAE Journal in February 2015. Data included in this article is from the 2014 editions of PSMJ's A/E Financial Performance Benchmark Survey Report and A/E Management Compensation Benchmark Survey Report.