2026 Financial Performance Benchmark Results
Are you managing your firm on data... or a hunch? Your competitors are looking at their financial metrics right now and making adjustments to outmaneuver you. Do you know if your overhead, utilization, and profit margins are healthy — or are you just hoping for the best?
Get the peer data you need to make undeniable executive decisions.
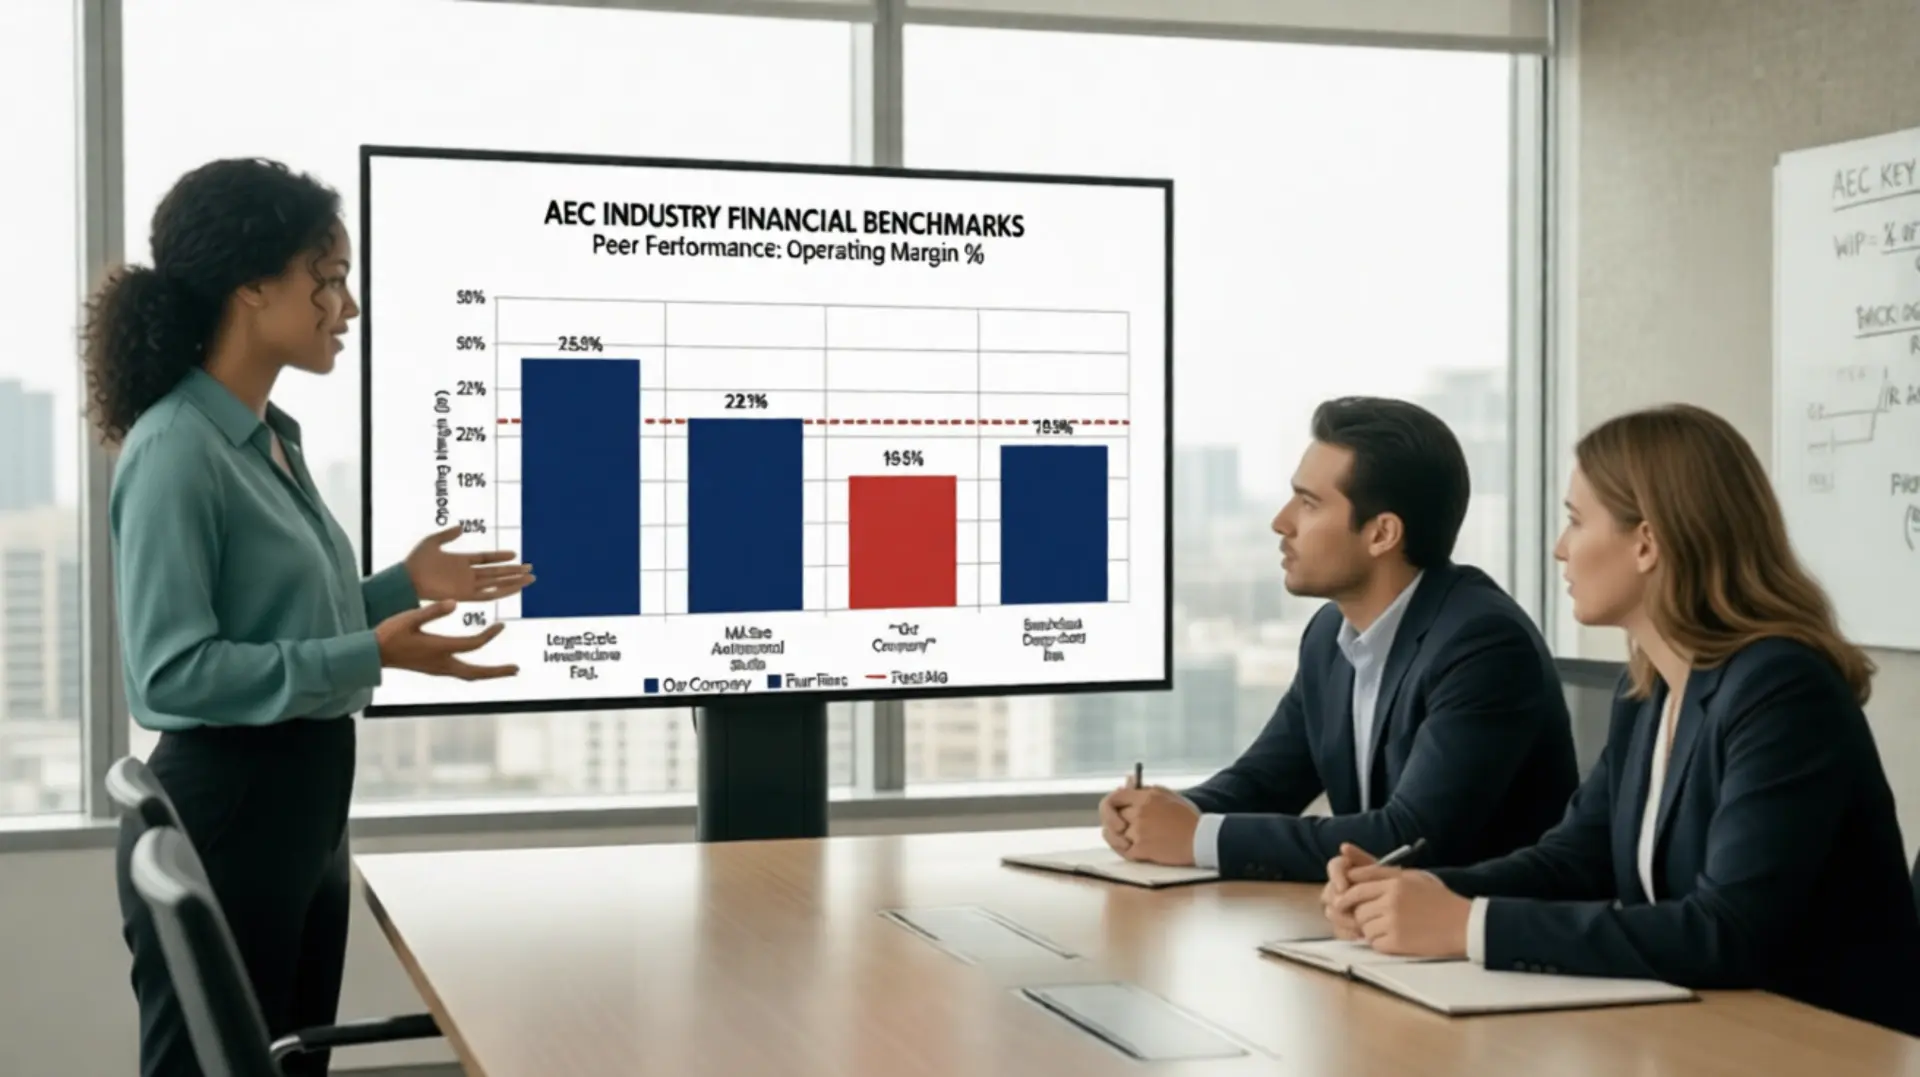
The Invisible Profit Killers Lurking in Your Financials
As an AEC leader, you look at your financial dashboard every week. On paper, everything looks fine. But "fine" can be incredibly dangerous.
The dashboard lies by omission
Revenue, backlog and payroll look fine on paper — but "fine" hides the invisible profit killers dragging down your bottom line.
Overhead and multipliers drift
Without peer data, you may be overpaying on labor overhead, lagging on cash collections, or settling for multipliers top firms would call a crisis.
You're flying blind
When you don't know what the firm down the street is achieving, every credit-line negotiation, bonus structure and growth target is just a guess.
The Solution: PSMJ's 2026 Financial Performance Benchmark Results
This isn't a data dump — it's an executive looking-glass. Filter hundreds of AEC firms by size, region, headcount and market sector served, so you can compare your firm to true peers.
What This Data Delivers for Your Firm
Give your executive team the clarity, confidence and competitive edge they need to thrive in 2026 and beyond.
Instant Clarity on 100+ KPIs
Drill past the superficial numbers. See exactly how your cash collection rates, target multipliers and staff turnover stack up against firms like yours.
Compare to True Peers
Filter by firm size, geographic region, headcount and specific market sectors served — for apples-to-apples comparisons that actually matter.
A Shield Against Bad Decisions
Stop relying on gut feelings or outdated industry folklore. Back every executive play with the most accurate, current data in the AEC industry.
Negotiate from Strength
Walk into credit-line negotiations, bonus reviews and growth target discussions with the numbers that the other side wishes they had.
Save Weeks of Research
Go from raw data to actionable comparisons in minutes — not the weeks it would take to assemble this on your own.
How It Works — 3 Simple Steps
From raw data to strategic decisions in minutes.
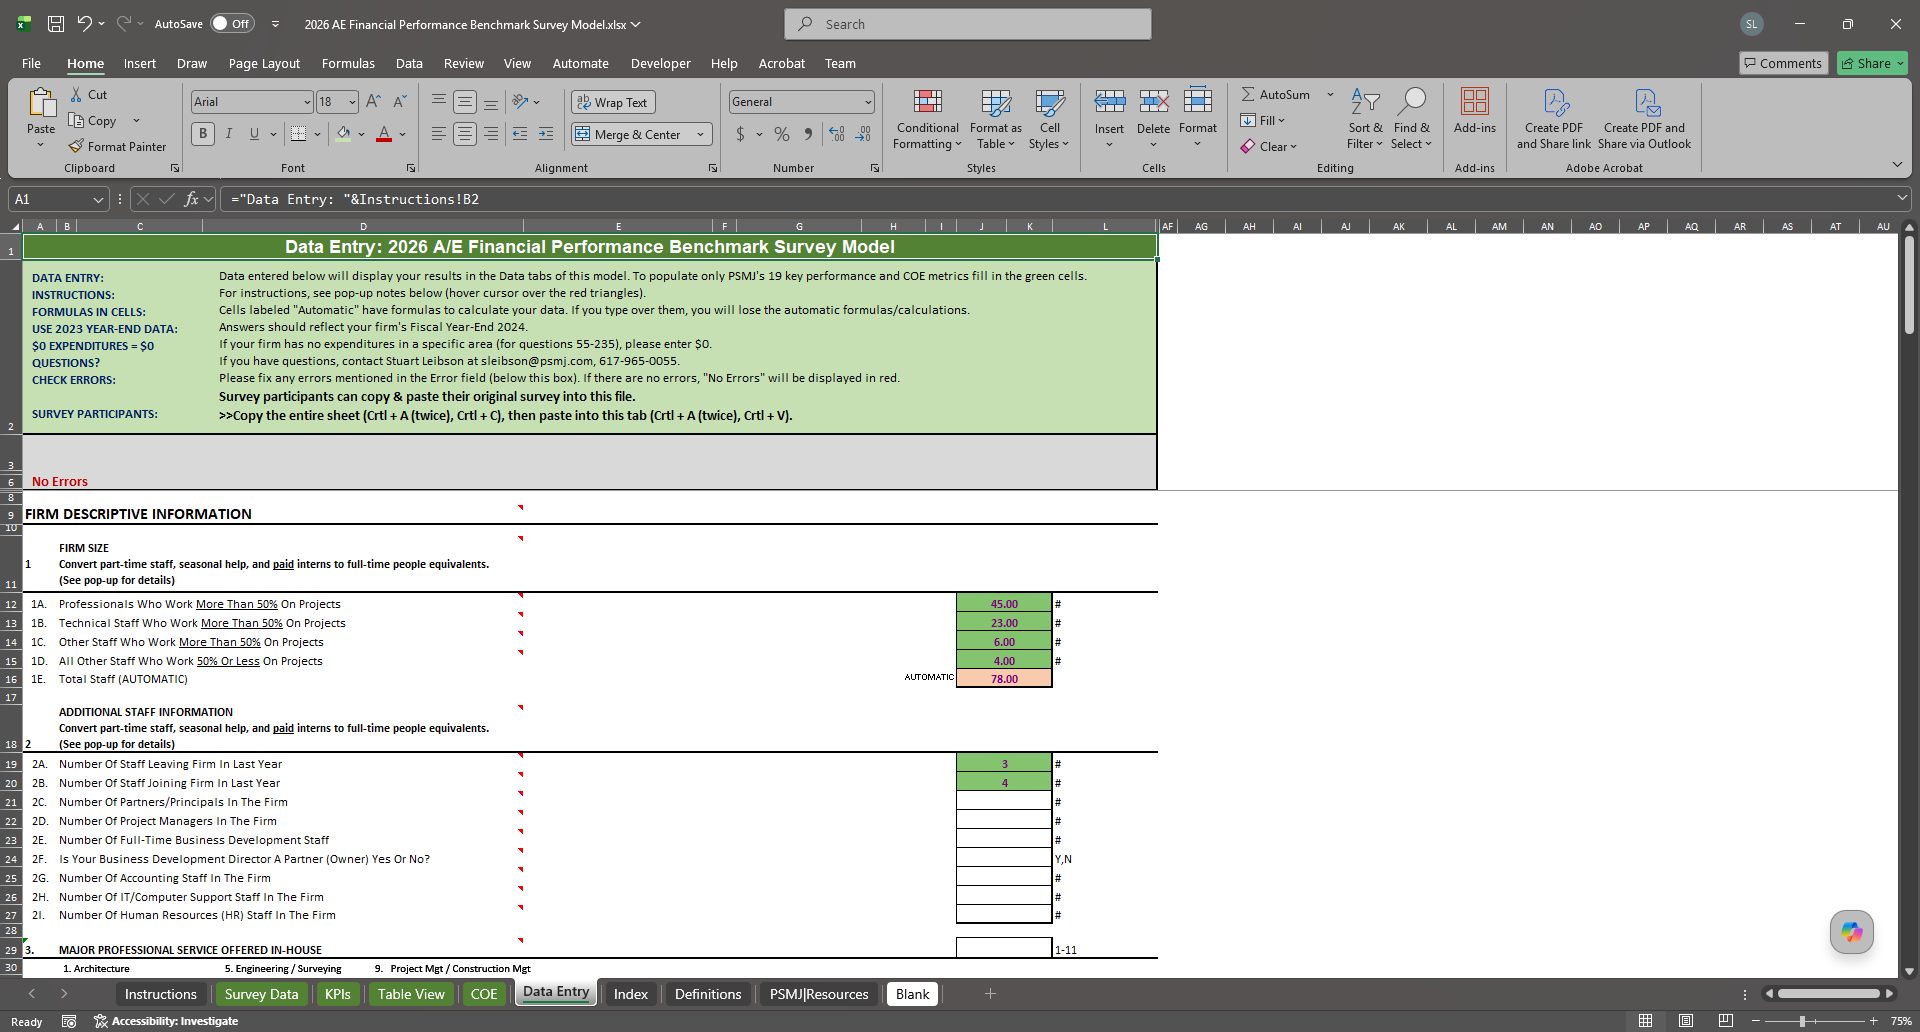
Enter your firm's financial performance data
Plug your year-end numbers into the easy-to-use Excel interface — staff counts, overhead, revenue, profit and 100+ other inputs.
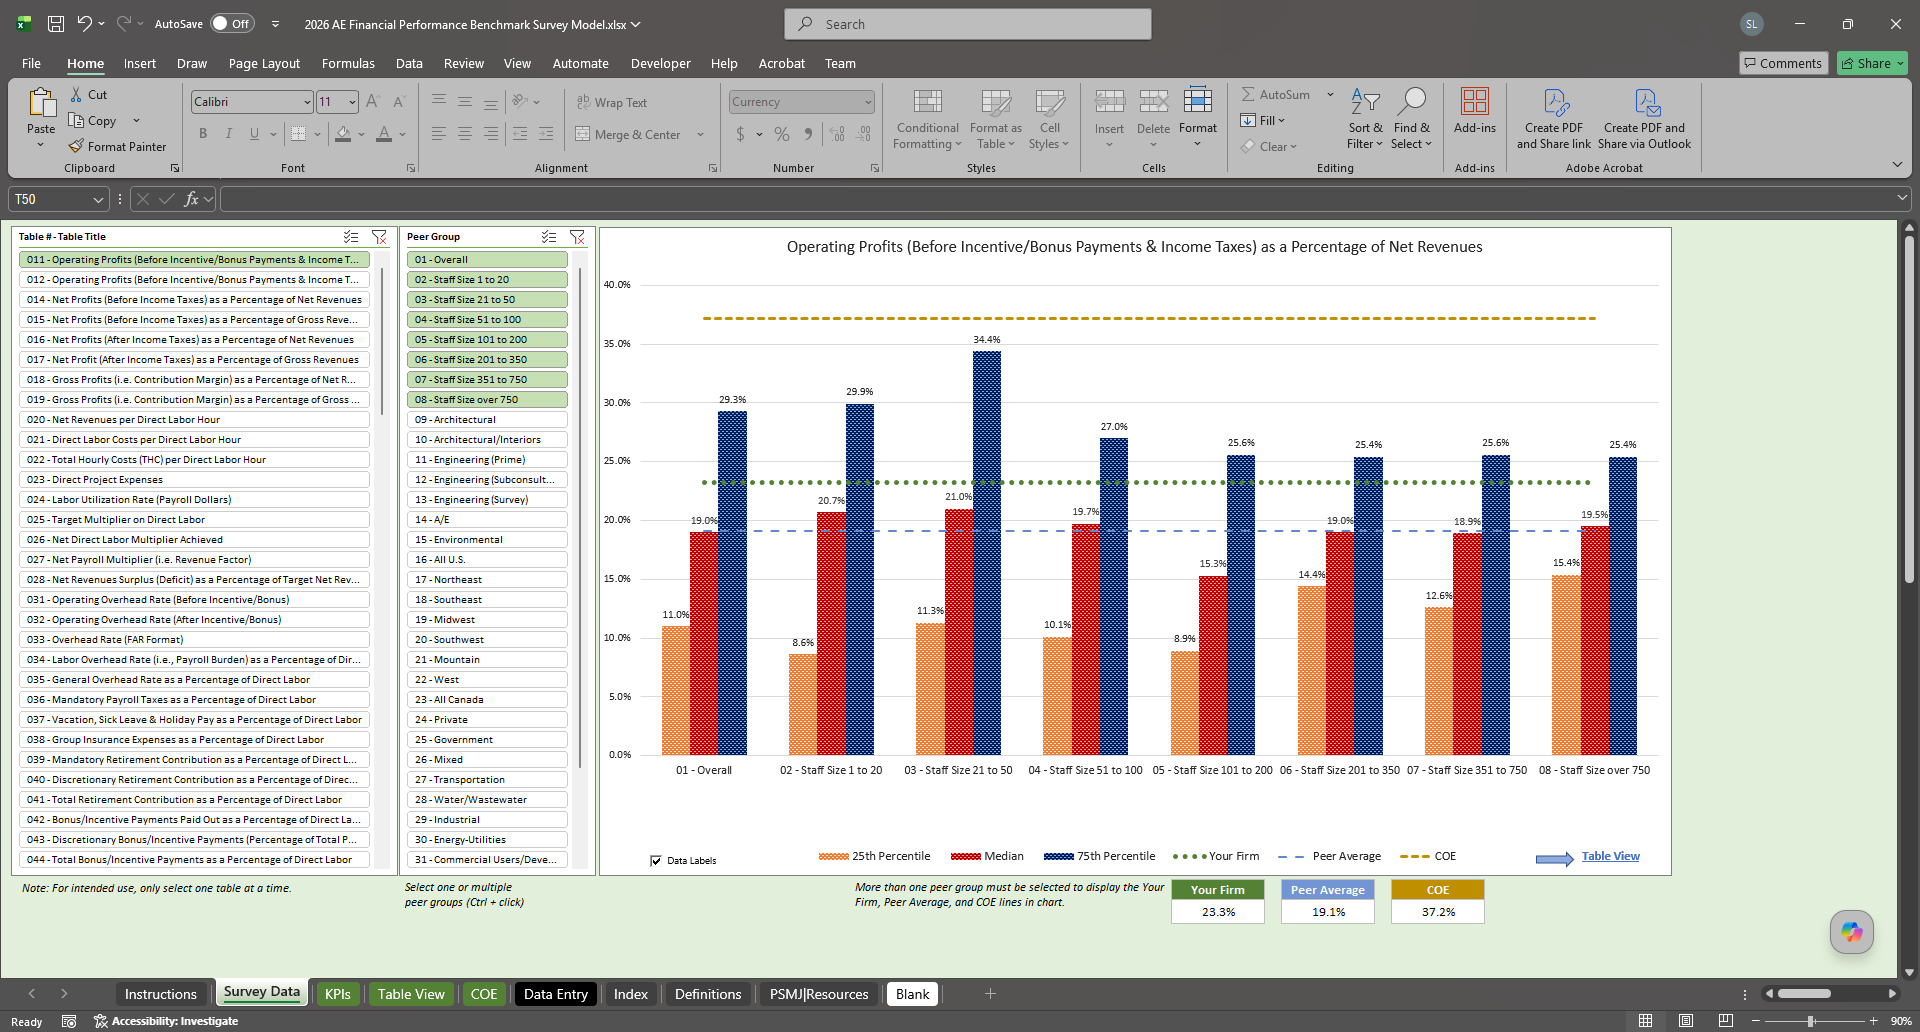
Quickly compare your firm against the KPIs that matter most
Filter by firm size, region, and market sector. See your firm's results plotted against the 25th, 50th, 75th percentile and the Circle of Excellence benchmark.
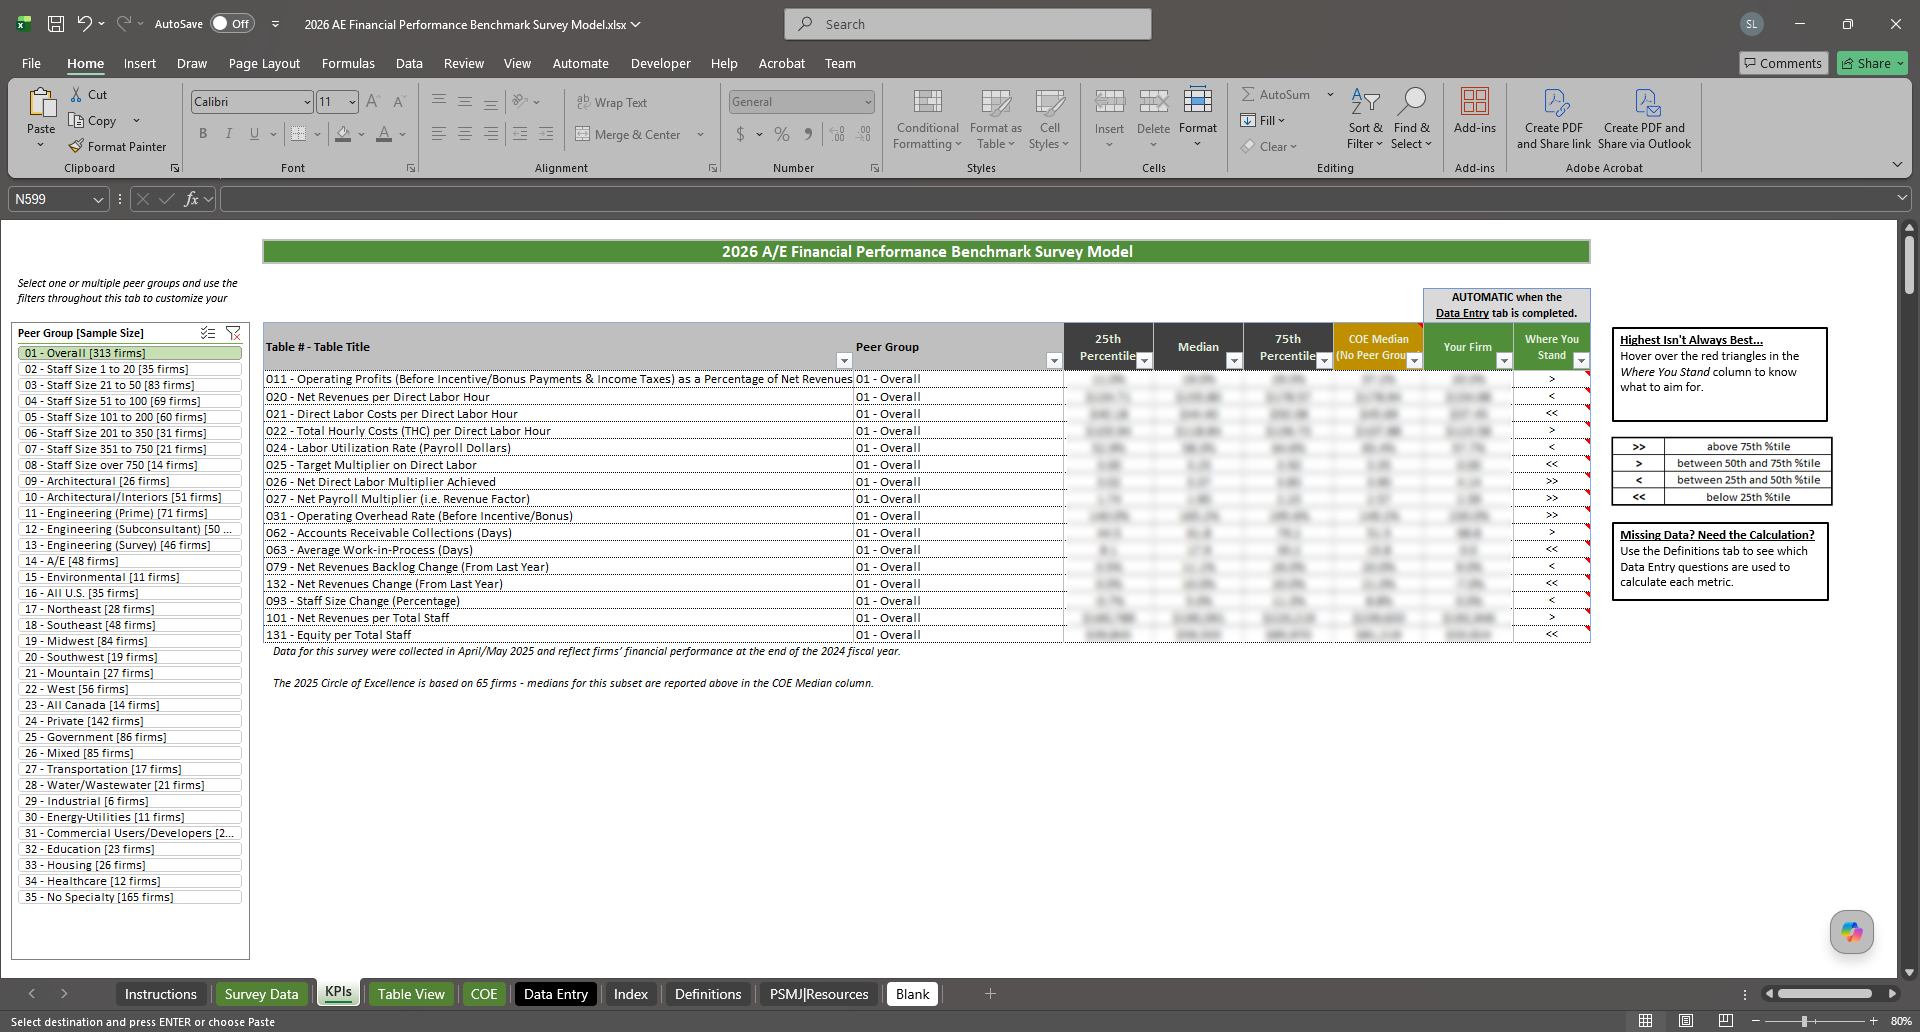
Dive deeper and make more confident financial management decisions
Drill into any of 100+ metrics across 35 peer groups to see exactly where you stand — and back every executive decision with peer-validated data.
Every KPI an AEC CFO Needs
117+ benchmarked metrics — from operating margin to overhead burden to per-staff profitability — filtered against true peers.
Featured Metrics
See the Full List by Category
- Operating Profits (Before Incentive/Bonus & Income Taxes) as a % of Gross Revenues
- Net Profits (Before Income Taxes) as a % of Gross Revenues
- Net Profits (After Income Taxes) as a % of Net Revenues
- Net Profit (After Income Taxes) as a % of Gross Revenues
- Gross Profits (Contribution Margin) as a % of Net Revenues
- Gross Profits (Contribution Margin) as a % of Gross Revenues
- Net Revenues per Direct Labor Hour
- Direct Labor Costs per Direct Labor Hour
- Total Hourly Costs (THC) per Direct Labor Hour
- Direct Project Expenses
- Net Payroll Multiplier (Revenue Factor)
- Net Revenues Surplus (Deficit) as a % of Target Net Revenues
- Labor Chargeability Rate (Payroll Hours)
- Operating Overhead Rate (After Incentive/Bonus)
- Labor Overhead Rate (Payroll Burden) as a % of Direct Labor
- General Overhead Rate as a % of Direct Labor
- Mandatory Payroll Taxes as a % of Direct Labor
- Vacation, Sick Leave & Holiday Pay as a % of Direct Labor
- Group Insurance Expenses as a % of Direct Labor
- Mandatory Retirement Contribution as a % of Direct Labor
- Discretionary Retirement Contribution as a % of Direct Labor
- Total Retirement Contribution as a % of Direct Labor
- Indirect Labor Rate (Without PTO, BD, IT) as a % of Direct Labor
- Indirect IT Expenses as a % of Direct Labor
- Space Expenses as a % of Direct Labor
- General Insurance Expenses as a % of Direct Labor
- Professional Liability Insurance as a % of Direct Labor
- Telephone Expenses as a % of Direct Labor
- Registrations & Licenses as a % of Direct Labor
- Interest Expenses as a % of Direct Labor
- Bad Debt Expenses as a % of Direct Labor
- Education Expenses as a % of Direct Labor
- Legal & Accounting as a % of Direct Labor
- Production Supplies as a % of Direct Labor
- Office Supplies as a % of Direct Labor
- State, Local Taxes, Permits & Licenses as a % of Direct Labor
- Bonus/Incentive Payments Paid Out as a % of Direct Labor
- Discretionary Bonus/Incentive Payments (% of Total Paid Out)
- Total Bonus/Incentive Payments as a % of Direct Labor
- Current Ratios With Deferred Taxes
- Current Ratios Without Deferred Taxes
- Total Debt-to-Equity Ratio
- Return on Total Assets
- Return on Payroll
- Bank Debt to Equity Ratio
- Line of Credit as a % of Net Revenues
- Return on Overhead (ROO)
- Return on Working Capital Assets (RoWC)
- Business Development Staff Comparisons — Principal in Charge of BD
- Total Staff to Full-Time BD Staff Ratio
- BD Costs vs Gross Revenues — With Full-Time BD Staff
- BD Costs vs Gross Revenues — Without Full-Time BD Staff
- BD Costs vs Net Revenues — With Full-Time BD Staff
- BD Costs vs Net Revenues — Without Full-Time BD Staff
- Labor as a % of Total BD Costs — With Full-Time BD Staff
- Labor as a % of Total BD Costs — Without Full-Time BD Staff
- Net Revenues Backlog Change (From Last Year)
- Net Revenues Backlog as a % of Annual Net Revenues
- Net Revenues Backlog — Days of Average Revenues
- Gross Revenues Change (From Last Year)
- Staff Size Change (Percentage)
- Technical Staff to Non-Technical Staff Ratio
- Technical Staff to Project Managers Ratio
- Technical Staff to Partners/Principals Ratio
- Total Staff to Partners/Principals Ratio
- Total Staff to Accounting Staff Ratio
- Total Staff to IT Staff Ratio
- Total Staff to HR Staff Ratio
- Total Staff to Professional Staff Ratio
- Technical Project Staff to Professional Staff Ratio
- Direct Labor Hours per Technical Staff
- Direct Labor Hours per Total Staff
- Direct Labor Hours per Project Manager
- Direct Labor Hours per Partner/Principal
- Net Revenues per Technical Staff
- Net Revenues per Project Manager
- Net Revenues per Partner/Principal
- Net Revenues per Accounting Staff
- Net Revenues per IT Staff
- Net Revenues per HR Staff
- Net Revenues per BD Staff
- Salary Costs (Without Incentive/Bonus) per Total Staff
- Other Costs per Total Staff
- Space Expenses per Total Staff
- Business Development Costs per Technical Staff
- Education Expenses per Total Staff (not including labor)
- Registrations & Licenses per Professional Staff
- Group Insurance Expenses per Total Staff
- Professional Liability Insurance per Total Staff
- Total Insurance Expenses per Total Staff
- Payroll Taxes per Total Staff
- Local Taxes, Permits & Licenses per Total Staff
- Total Taxes per Total Staff
- IT Operating Expenses per Total Staff
- General Overhead Rate per Technical Staff
- General Overhead Rate per Total Staff
- Operating Profits per Technical Staff (Before Incentive/Bonus & Income Taxes)
- Operating Profits per Total Staff (Before Incentive/Bonus & Income Taxes)
- Operating Profits per Project Manager (Before Incentive/Bonus & Income Taxes)
- Operating Profits per Partner/Principal (Before Incentive/Bonus & Income Taxes)
- Net Revenues Surplus (Deficit) per Total Staff
- Accounts Receivable per Total Staff
- Fixed Assets per Total Staff
- Total Assets per Total Staff
- Equity per Total Staff
Choose the Format That Fits Your Firm
One purchase. All the peer data your executive team needs.

Excel Model
Microsoft Excel
- Interactive Excel benchmark model
- 100+ KPIs across 35 peer groups
- Filter by firm size, region & sector
- Enter your firm's data for instant comparison
- Built-in charts and tables

PDF Report
PDF Report
- Full PDF benchmark report
- 100+ KPIs across 35 peer groups
- Pre-built charts & tables
- Easy to share with your leadership team
- Best for read-only review
Excel & PDF Bundle
Excel Model + PDF Report
- Everything in the Excel Model
- Everything in the PDF Report
- Interactive analysis + boardroom-ready PDF
- Save $697 vs buying both separately
- The complete benchmarking toolkit
Stop Guessing. Start Leading.
Give your executive team the clarity, confidence, and competitive edge they need to thrive in 2026 and beyond. Order the 2026 Financial Performance Benchmark Results today.